Grafana Notes
1. 前言
Grafana常被用作数据展示界面,虽然实际上它还有很多其他相关的功能,但一般都不会使用。在CNCF的项目中,一般Grafana都和Prometheus结合使用。Grafana的最大优势在于其灵活性,它作为数据界面可以利用相当多种类的后台数据源。在我构想中的系统里,ELK也是相当重要的一个组成部分,而Grafana也可以作为ElasticSearch的前台界面,这就相当好用。
由于其相当于仅只是一个UI,所以本文中架构之类的内容基本上会很少,主要是概念介绍和使用细节方面的。
下文所有内容都基于版本:v6.1.2。
$ ./bin/grafana-server -v
Version 6.1.2 (commit: de8f6ac, branch: HEAD)
2. 安装 & 文件位置 & 启动
2.1 安装
官方文档:Download Grafana。
官方站点做得很好,直接按指示操作即可。MAC安装很方便,使用brew装是最佳选择,另外也可以wget下载tar包,解压即用。Go应用程序就这点,真的太赞了。
brew update
brew install grafana

or

wget https://dl.grafana.com/oss/release/grafana-6.1.2.darwin-amd64.tar.gz
tar -zxvf grafana-6.1.2.darwin-amd64.tar.gz
2.2 文件位置
解压出来的Grafana文件夹可以简单看一下,基本上运行的文件位置就是按这个安排的:
bin                 # grafana-server & grafana-cli
conf                # 配置文件夹
data \              # 运行时产生的文件,刚解压出来时还不存在
     | log          # 日志输出
     | plugins      # 安装的第三方插件等
     | png
     | grafana.db   # sqlite3数据库
public              # 展示相关的内容,HTML、CSS等
scripts             # bash脚本,忽略
tools # 忽略上面的data文件夹及里面的内容等,都是默认的配置文件的设定,如果没有特殊需求,一般直接这样运行就可以了。
如果将Grafana的运行文件夹指定在某个位置的话,一些文件夹是可能需要调整(配置文件中):
# Path to where grafana can store temp files, sessions, and the sqlite3 db (if that is used)
data = data/grafana
# Directory where grafana can store logs
logs = log
# Directory where grafana will automatically scan and look for plugins
plugins = data/grafana/plugins
# folder that contains provisioning config files that grafana will apply on startup and while running.
provisioning = conf/provisioning
# the path relative working path
static_root_path = data/grafana/public上面的所有文件夹实际上都是相对路径,相对于Grafana启动时候指定的工作路径:--homepath。
2.3 配置文件
官方文档:Configuration。
配置文件中的选项基本上和运行时和监控关系不大,都是一些设置向的内容,配置过一次之后就不需要变动了。一些可能需要关心的选项:
# Protocol (http, https, socket)
protocol = http
# The ip address to bind to, empty will bind to all interfaces
http_addr = 127.0.0.1
# The http port to use
http_port = 3000
# The public facing domain name used to access grafana from a browser
domain = localhost
# Either "mysql", "postgres" or "sqlite3", it's your choice
type = sqlite3
# Server reporting, sends usage counters to stats.grafana.org every 24 hours.
# No ip addresses are being tracked, only simple counters to track
# running instances, dashboard and error counts. It is very helpful to us.
# Change this option to false to disable reporting.
reporting_enabled = false
# Set to false to disable all checks to https://grafana.com
# for new versions (grafana itself and plugins), check is used
# in some UI views to notify that grafana or plugin update exists
# This option does not cause any auto updates, nor send any information
# only a GET request to https://grafana.com to get latest versions
check_for_updates = false
# disable user signup / registration
allow_sign_up = false
# Allow non admin users to create organizations
allow_org_create = false
2.4 启动
启动这块就有个让人很头疼的事情,真的让我始料未及。
让Grafana作为一个WEB应用启动,需要用到的是bin/grafana-server这个命令,其帮助可以在资料查看。
有用的参数只有两个:
--config:指定配置文件位置--homepath:指定Grafana工作的根目录
如果是将下载下来的Grafana直接解包运行,不更改路径的话,那就不需要任何启动参数,直接运行即可。但如果需要更改运行根目录的话,就需要使用--homepath这个选项:
$ ./bin/grafana-server --homepath "/Users/XXX/.../"而我遇到的问题是--config这个选项,无论我指定任何内容:
- 相对于
--homepath的相对文件位置:config/grafana/grafana.ini - 相对于
--homepath的相对文件夹:config/grafana/ - 绝对文件路径:
/Users/XXX/.../config/grafana/grafana.ini - 绝对文件夹:
/Users/XXX/.../config/grafana/
它都不能正常工作,只会返回给我错误:
Grafana-server Init Failed: Could not find config defaults, make sure homepath command line parameter is set or working directory is homepath
真的让人相当恼火,官方文档里还有这块的解说,但说了根本就和没说一个样:Config file locations。
最后只能使用:
Default configuration from $WORKING_DIR/conf/defaults.ini
也就是在默认的配置文件位置上放上文件:${--homepath}/conf/defaults.ini,才正常工作起来,哎。
2.5 CLI
官方文档:Grafana CLI。
Grafana还提供了一个命令行工具来辅助admin平时的操作:bin/grafana-cli,使用可以看:
$ ./bin/grafana-cli -h2.6 登录 & 访问
默认第一次使用的用户名和密码是:admin:admin,第一次登录进去之后系统就会要求更改admin密码。访问地址在配置文件里是可以更改的,默认为:http://localhost:3000。
3. 概念
DataSource:数据源,Grafana仅只是一个UI,真正保存数据的是数据源,根据版本不同支持的数据源可能不尽相同,有需要可以查看官方文档:Data Source Overview- 用户 & 权限:
Organization:组织,用在多个组织部门使用同一个Grafana的情况,可以根据组织的不同区分可访问的面板User:用户Role:角色,目前暂时只支持固定的角色:Admin、Editor、Read Only Editor、Viewer,相关:How to create new user roles? #9877
Panel:面板,Grafana的核心,实际上负责进行图形展示的单元,类型非常多,有需要可以查看官方文档:Graph PanelRow:行,Dashboard的下级逻辑分隔概念,一个Row里可以放入很多Panel,而且这里需要理解Row并不是物理上的行(实际上一个Row可以容纳很多行Panel)Dashboard:仪表盘,由大量Panel组成的集合,一般来说Dashboard是按某个目标进行设计的,比如说:机房的当前状况,某个应用的服务状况等Plugins:插件,提供更多的额外功能集成,官方商店在:PluginsPlaylist:举例来说就是某些大公司在门口做的数据滚动播放展示,类似那样的功能,官方文档:PlaylistProvisioning:通过配置文件的方式对DataSource及Dashboard进行设置,这是Grafana在使用API进行相关设置之外的另一种方法,且其不要求Grafana首先启动,使用上更为便利Templating:模板,对某些共性的Panel或Dashboard进行抽象,以便后续进行复用
Provisioning官方文档:Provisioning Grafana
在以前的Grafana版本中,你只能使用API来配置数据源和仪表盘,但是,这需要在开始创建仪表板之前运行服务,并且还需要为HTTP API设置证书。在v5.0中,我们决定通过添加使用配置文件的新的活动Provisioning系统来改善这种体验,这将使GitOps更加自然,因为可以通过可以进行版本控制的文件来定义数据源和仪表盘,我们希望扩展此系统以便稍后添加对用户,组织和警报的支持。
4. 使用简介
4.1 日常使用
理解了上面的概念之后,日常功能无非就是以下几项:
- 创建User
- 创建organization
- 管理User和Organization以及Roles
- 创建Dashboard,需要根据实际应用场景进行规划
- 创建Rows,如果有必要的话
- 在Dashboard上创建Panel
- 将Panel及Dashboard做成Templating复用,如果有必要的话
4.2 数据保存 & 导出
Dashboard在面板上面的工具栏里有Settings选项,进入之后有一项JSON Model,这就是当前Dashboard的所有内容了,都做成了JSON文本进行描述。如果你查看过Grafana的数据库的话,你也可以看到Dashboard表只有一列,是用来存储这个数据的,其他任何地方都没有和Dashboard的内容相关的字段。只要复制了这个字段,也就完成了当前Dashboard的备份,当然也可以将这个JSON字符串做成*.json文件进行备份。
Panel也有类似的功能,在Panel的Title进行点击,会有下拉菜单,然后More > Panel Json就是了。
4.3 数据源
Grafana支持多种数据源,根据不同数据源有不同的一些细微的功能差别以及配置差别,可以查看官方文档:
这里面最有可能会用得到的就是Templating相关内容,在制作数据模板的时候很有用。
Grafana和ELK相整合的文章可以看这篇:ELKstack 中文指南 > Grafana。
5. 监控指标
Grafana做的好就好在其和其他监控系统的集成相当好,Grafana自身的相关监控指标也可以和Prometheus一样暴露出来,使用的格式也是Prometheus的格式,默认是在:http://localhost:3000/metrics。
我在本文中也留了一份,有必要可以研究下里面的内容:grafana/metrics。
6. Docker实践
接下来的章节会从实践的角度来尝试在容器中安装和使用Grafana。数据源皆为Prometheus,此后不再备注。
6.1 Docker安装
在容器内安装官方有指导文档:Installing using Docker。主要了解几个重点:
- 配置文件中的选项如何使用env参数来进行调整,如何进行配置名字映射:Configuration
- 容器内的一些路径,以及如何调整这些默认路径:Default Paths
- 如何在启动时就自动安装插件(保证启动完成立即可用):Installing Plugins for Grafana
- 映射volume,保证数据不会被清除:Grafana container with persistent storage
6.2 Compose配置
可运行的docker compose配置文件范例,参见:dist-system-practice/conf/dev/prometheus-cluster.yaml。
重点是environment部分。
6.3 Provisioning
既然已经要求Grafana在容器内使用,那么一般也就要做到启动即可用。Grafana在使用之前一般需要几步配置:
- 用户、密码管理
- 数据源配置
- Dashboard配置
用户和密码之类的设置,可用通过容器的env配置解决,而数据源和Dashboard就比较麻烦了。Grafana官方提供了一个解决方案,非常好用:Provisioning Grafana。简单来说就是提供两个配置文件,一个用来告诉Grafana启动时需要输入的数据源有哪些,另一个告诉Grafana启动时候需要导入的Dashboard有哪些。
存储provisioning配置文件的指定路径在之前6.1中提到的默认路径中有,一般使用bind mount的方式将本地的provisioning配置文件导入到容器中。
GF_PATHS_PROVISIONING=/etc/grafana/provisioning- 数据源配置文件范例,参见:dist-system-practice/vendors/prometheus/grafana/provisioning/datasources/datasource.yaml
- Dashboard配置文件范例,参见:dist-system-practice/vendors/prometheus/grafana/provisioning/dashboards/providers.yaml。实际上就是指定一个文件夹,一般也是用bind mount的方式mapping到容器内即可。
6.4 Dashboard
Grafana的灵活和强大在Dashboard上体现无疑,关键好用在于不仅仅界面美观、功能强大,而且还可以模板化,可导入导出,做到一次编写后续自动安装、更新。官方还有一个Grafana Labs > Dashboards,类似于插件中心的地方,方便社区将做好的Dashboard进行分享。
一般常用的组件,只要简单搜索下就可以找到可用的Dashboard,大大降低了监控的难度,加速了研发的进程。
6.4.1 Variables
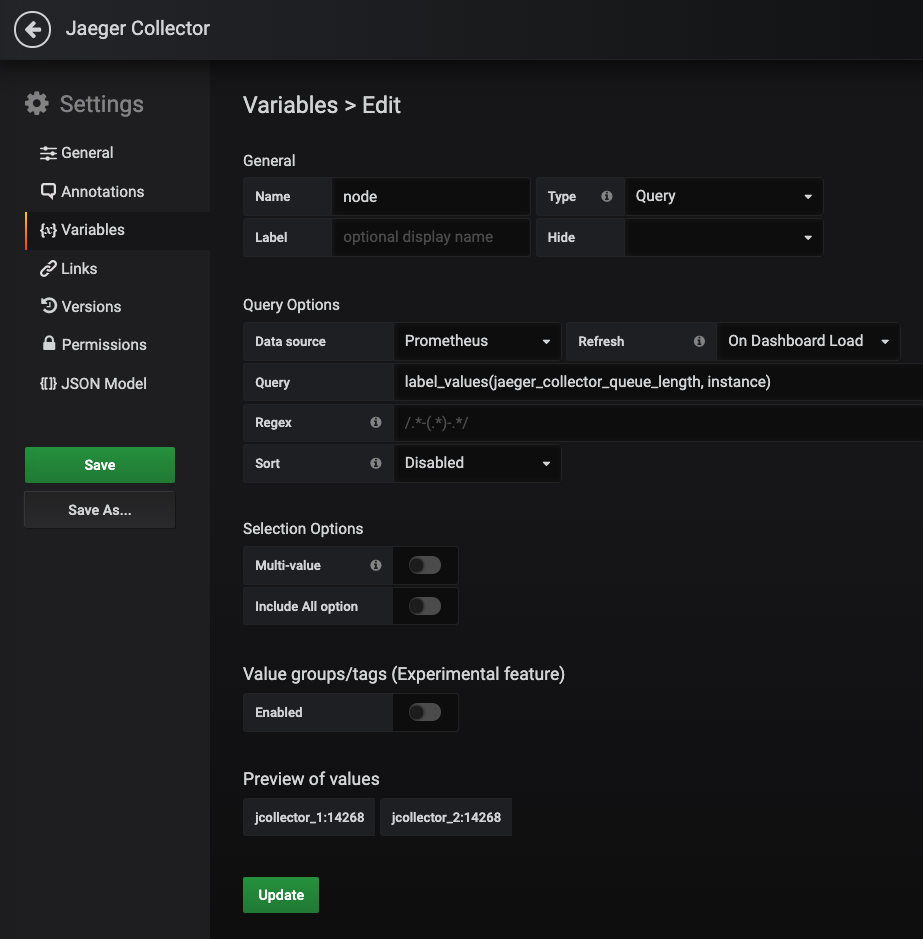
这里简单说下在进行Dashboard模板化的时候常见的variables设置问题。一般来说,在一个系统中,同角色的设备不会只有单个节点,大多数情况都会有多个节点,比如说web服务器、数据库服务器等。在进行监控的时候,只需要制作一份Grafana Dashboard,将里面的参数变量化,就可以将这个Dashboard模板化,方便后续使用。
而模板化最关键就是要将节点做成可配置的变量,这里就需要进行Dashboard的variables设置。进入到Dashboard的Setting中,左边列表里就有variables设置的入口,设置方法可以参见下图:
7. TODO
囿于当前使用的深度及项目调研的时间限制,有部分内容做的还不够深入,后续可以考虑补全:
- Grafana本身的性能,应该如何衡量
- Grafana暴露出来的Metrics需要仔细研究下
- 所有的图表全部尝试一遍
- 热力图的应用范围及实际使用范例
- 常用 & 有用的插件列表整理
- ELK整合使用必要性调研,Kibana是否够用,是否有必要使用Grafana作为ELK的前台UI
- ELK结合使用范例
8. 写在最后
了解Metrics的含义才是最关键的,就像我在写Prometheus Notes说的,很多exporter会吐出巨量的Metrics数据,你都了解这些Metrics代表的意义吗?如果不了解的话,那些数据即便采集进去了,你又会去用了?说到底Prometheus和Grafana不过就是个工具,关键还是在于工程师想要了解什么,对自己的系统的监控需求是什么。
监控相关工作的第一步是梳理当前系统的组成组件,将每一个都列出来,将它们负责的职责明确清楚,然后将需要监控的Metrics都枚举出来,将这些Metrics需要做成的表类型都想清楚,最后才是使用Prometheus采集数据,使用Grafana制图。
和写代码一样,优秀的工程师花的更多的时间是在思考和设计上,而不是实际的编写代码。如果不理解这点,那就永远只能是二流。
资料
链接
grafana -h {#ID_APP_GRAFANA_HELP}
$ ./bin/grafana-server -h
Usage of ./bin/grafana-server:
  -config string
    	path to config file
  -homepath string
    	path to grafana install/home path, defaults to working directory
  -packaging string
    	describes the way Grafana was installed (default "unknown")
  -pidfile string
    	path to pid file
  -profile
    	Turn on pprof profiling
  -profile-port int
    	Define custom port for profiling (default 6060)
  -test.bench regexp
    	run only benchmarks matching regexp
  -test.benchmem
    	print memory allocations for benchmarks
  -test.benchtime d
    	run each benchmark for duration d (default 1s)
  -test.blockprofile file
    	write a goroutine blocking profile to file
  -test.blockprofilerate rate
    	set blocking profile rate (see runtime.SetBlockProfileRate) (default 1)
  -test.count n
    	run tests and benchmarks n times (default 1)
  -test.coverprofile file
    	write a coverage profile to file
  -test.cpu list
    	comma-separated list of cpu counts to run each test with
  -test.cpuprofile file
    	write a cpu profile to file
  -test.failfast
    	do not start new tests after the first test failure
  -test.list regexp
    	list tests, examples, and benchmarks matching regexp then exit
  -test.memprofile file
    	write an allocation profile to file
  -test.memprofilerate rate
    	set memory allocation profiling rate (see runtime.MemProfileRate)
  -test.mutexprofile string
    	write a mutex contention profile to the named file after execution
  -test.mutexprofilefraction int
    	if >= 0, calls runtime.SetMutexProfileFraction() (default 1)
  -test.outputdir dir
    	write profiles to dir
  -test.parallel n
    	run at most n tests in parallel (default 8)
  -test.run regexp
    	run only tests and examples matching regexp
  -test.short
    	run smaller test suite to save time
  -test.testlogfile file
    	write test action log to file (for use only by cmd/go)
  -test.timeout d
    	panic test binary after duration d (default 0, timeout disabled)
  -test.trace file
    	write an execution trace to file
  -test.v
    	verbose: print additional output
  -v	prints current version and exits
grafana/metrics {#ID_APP_SELF_METRICS}
# HELP grafana_alerting_active_alerts amount of active alerts
# TYPE grafana_alerting_active_alerts gauge
grafana_alerting_active_alerts 0
# HELP grafana_alerting_execution_time_milliseconds summary of alert exeuction duration
# TYPE grafana_alerting_execution_time_milliseconds summary
grafana_alerting_execution_time_milliseconds{quantile="0.5"} NaN
grafana_alerting_execution_time_milliseconds{quantile="0.9"} NaN
grafana_alerting_execution_time_milliseconds{quantile="0.99"} NaN
grafana_alerting_execution_time_milliseconds_sum 0
grafana_alerting_execution_time_milliseconds_count 0
# HELP grafana_api_admin_user_created_total api admin user created counter
# TYPE grafana_api_admin_user_created_total counter
grafana_api_admin_user_created_total 0
# HELP grafana_api_dashboard_get_milliseconds summary for dashboard get duration
# TYPE grafana_api_dashboard_get_milliseconds summary
grafana_api_dashboard_get_milliseconds{quantile="0.5"} NaN
grafana_api_dashboard_get_milliseconds{quantile="0.9"} NaN
grafana_api_dashboard_get_milliseconds{quantile="0.99"} NaN
grafana_api_dashboard_get_milliseconds_sum 0
grafana_api_dashboard_get_milliseconds_count 0
# HELP grafana_api_dashboard_save_milliseconds summary for dashboard save duration
# TYPE grafana_api_dashboard_save_milliseconds summary
grafana_api_dashboard_save_milliseconds{quantile="0.5"} NaN
grafana_api_dashboard_save_milliseconds{quantile="0.9"} NaN
grafana_api_dashboard_save_milliseconds{quantile="0.99"} NaN
grafana_api_dashboard_save_milliseconds_sum 0
grafana_api_dashboard_save_milliseconds_count 0
# HELP grafana_api_dashboard_search_milliseconds summary for dashboard search duration
# TYPE grafana_api_dashboard_search_milliseconds summary
grafana_api_dashboard_search_milliseconds{quantile="0.5"} NaN
grafana_api_dashboard_search_milliseconds{quantile="0.9"} NaN
grafana_api_dashboard_search_milliseconds{quantile="0.99"} NaN
grafana_api_dashboard_search_milliseconds_sum 0
grafana_api_dashboard_search_milliseconds_count 0
# HELP grafana_api_dashboard_snapshot_create_total dashboard snapshots created
# TYPE grafana_api_dashboard_snapshot_create_total counter
grafana_api_dashboard_snapshot_create_total 0
# HELP grafana_api_dashboard_snapshot_external_total external dashboard snapshots created
# TYPE grafana_api_dashboard_snapshot_external_total counter
grafana_api_dashboard_snapshot_external_total 0
# HELP grafana_api_dashboard_snapshot_get_total loaded dashboards
# TYPE grafana_api_dashboard_snapshot_get_total counter
grafana_api_dashboard_snapshot_get_total 0
# HELP grafana_api_dataproxy_request_all_milliseconds summary for dataproxy request duration
# TYPE grafana_api_dataproxy_request_all_milliseconds summary
grafana_api_dataproxy_request_all_milliseconds{quantile="0.5"} NaN
grafana_api_dataproxy_request_all_milliseconds{quantile="0.9"} NaN
grafana_api_dataproxy_request_all_milliseconds{quantile="0.99"} NaN
grafana_api_dataproxy_request_all_milliseconds_sum 0
grafana_api_dataproxy_request_all_milliseconds_count 0
# HELP grafana_api_login_oauth_total api login oauth counter
# TYPE grafana_api_login_oauth_total counter
grafana_api_login_oauth_total 0
# HELP grafana_api_login_post_total api login post counter
# TYPE grafana_api_login_post_total counter
grafana_api_login_post_total 0
# HELP grafana_api_models_dashboard_insert_total dashboards inserted
# TYPE grafana_api_models_dashboard_insert_total counter
grafana_api_models_dashboard_insert_total 0
# HELP grafana_api_org_create_total api org created counter
# TYPE grafana_api_org_create_total counter
grafana_api_org_create_total 0
# HELP grafana_api_response_status_total api http response status
# TYPE grafana_api_response_status_total counter
grafana_api_response_status_total{code="200"} 0
grafana_api_response_status_total{code="404"} 0
grafana_api_response_status_total{code="500"} 0
grafana_api_response_status_total{code="unknown"} 0
# HELP grafana_api_user_signup_completed_total amount of users who completed the signup flow
# TYPE grafana_api_user_signup_completed_total counter
grafana_api_user_signup_completed_total 0
# HELP grafana_api_user_signup_invite_total amount of users who have been invited
# TYPE grafana_api_user_signup_invite_total counter
grafana_api_user_signup_invite_total 0
# HELP grafana_api_user_signup_started_total amount of users who started the signup flow
# TYPE grafana_api_user_signup_started_total counter
grafana_api_user_signup_started_total 0
# HELP grafana_aws_cloudwatch_get_metric_data_total counter for getting metric data time series from aws
# TYPE grafana_aws_cloudwatch_get_metric_data_total counter
grafana_aws_cloudwatch_get_metric_data_total 0
# HELP grafana_aws_cloudwatch_get_metric_statistics_total counter for getting metric statistics from aws
# TYPE grafana_aws_cloudwatch_get_metric_statistics_total counter
grafana_aws_cloudwatch_get_metric_statistics_total 0
# HELP grafana_aws_cloudwatch_list_metrics_total counter for getting list of metrics from aws
# TYPE grafana_aws_cloudwatch_list_metrics_total counter
grafana_aws_cloudwatch_list_metrics_total 0
# HELP grafana_build_info A metric with a constant '1' value labeled by version, revision, branch, and goversion from which Grafana was built.
# TYPE grafana_build_info gauge
grafana_build_info{branch="HEAD",edition="oss",goversion="go1.11.5",revision="de8f6ac",version="6.1.2"} 1
# HELP grafana_db_datasource_query_by_id_total counter for getting datasource by id
# TYPE grafana_db_datasource_query_by_id_total counter
grafana_db_datasource_query_by_id_total 0
# HELP grafana_info Information about the Grafana. This metric is deprecated. please use `grafana_build_info`
# TYPE grafana_info gauge
grafana_info{version="6.1.2"} 1
# HELP grafana_instance_start_total counter for started instances
# TYPE grafana_instance_start_total counter
grafana_instance_start_total 1
# HELP grafana_page_response_status_total page http response status
# TYPE grafana_page_response_status_total counter
grafana_page_response_status_total{code="200"} 0
grafana_page_response_status_total{code="404"} 0
grafana_page_response_status_total{code="500"} 0
grafana_page_response_status_total{code="unknown"} 0
# HELP grafana_proxy_response_status_total proxy http response status
# TYPE grafana_proxy_response_status_total counter
grafana_proxy_response_status_total{code="200"} 0
grafana_proxy_response_status_total{code="404"} 0
grafana_proxy_response_status_total{code="500"} 0
grafana_proxy_response_status_total{code="unknown"} 0
# HELP grafana_stat_active_users number of active users
# TYPE grafana_stat_active_users gauge
grafana_stat_active_users 1
# HELP grafana_stat_total_orgs total amount of orgs
# TYPE grafana_stat_total_orgs gauge
grafana_stat_total_orgs 1
# HELP grafana_stat_total_playlists total amount of playlists
# TYPE grafana_stat_total_playlists gauge
grafana_stat_total_playlists 0
# HELP grafana_stat_total_users total amount of users
# TYPE grafana_stat_total_users gauge
grafana_stat_total_users 1
# HELP grafana_stat_totals_dashboard total amount of dashboards
# TYPE grafana_stat_totals_dashboard gauge
grafana_stat_totals_dashboard 0
EOF