Prometheus Notes
- 1. 前言
- 2. 竞品比较
- 3. 基础 & 日常使用
- 4. 架构设计
- 5. Prometheus监控指标
- 6. 范例
- 7. Docker实践
- 8. 常用监控
- 9. TODO
- 资料
1. 前言
对于分布式系统来说,监控是非常重要的,少了精密的监控应用程序的状况就无法得知了,也很难查找问题。而在云原生的年代,监控系统(或者说分布式系统的所有组件)最好是使用Go语言编写的,这样才能做到最小的镜像、最高的性能、最佳的CPU利用。所以监控系统的选择其实也不是那么的难,直接用CNCF的Prometheus就可以了。虽然说是这么说,实际使用之前对于工具的理解还是有必要的,因此有了此文。
此外,这里简单讲下,官方的文档,怎么说呢,只能说是一个”手册”。假设,Prometheus的作者(这里假设是一个自然人)花了100个小时编完了Prometheus的代码,那么这个官方文档估计也就只花了30分钟,内容完全就是一堆细节的堆砌,完全没动脑子。所以,如果你是一名初学者,建议直接忽略官方的文档,去找第三方的书来看。这份文档只对需要跟着最新版本走的工程师,或者需要查找下一些Prometheus知识点或使用方法的工程师有点用。
这里推荐一本中文的gitbook:prometheus-book。从起始的安装和使用例子,到后面的集群管理以及exporter等等,都做了非常详实的解说,最可贵的是,作者写的内容是基于思考、组织之后的,明确地是为了读者服务的,而不像官方文档,仅仅只是一堆细节的罗列。
版本申明,后续的所有行文内容都基于Prometheusv2.8.1:
$ prometheus --version
prometheus, version 2.8.1 (branch: HEAD, revision: 4d60eb36dcbed725fcac5b27018574118f12fffb)
  build user:       root@bfdd6a22a683
  build date:       20190328-18:09:49
  go version:       go1.11.6
2. 竞品比较
作为一个领域的后来者,最聪明的做法就是在自己的手册里与各位竞品前辈大佬进行一下横向比较,甚至附上性能的benchmark,这样才能取得新使用者的信任。而Prometheus在官方文档的最开始,就有一篇:COMPARISON TO ALTERNATIVES(这其实也是了解监控相关软件功能的很好的普及文)。
文中主要提到了5个工具进行横向比较:Graphite、InfluxDB、OpenTSDB、Nagios、Sensu。
翻译放在最后的资料部分(继续喷下官方文档,这篇比较也写得不怎么样,看完没get到优势或者劣势的点)。
2.1 COMPARISON TO ALTERNATIVES 小结
简单过一下的话:
- Nagios和Sensu基本上可以直接忽略
- OpenTSDB是基于Hadoop/HBase的,扩展性应该说不错,但过重,且对于Ops的要求比较高
- InfluxDB相当不错,但其杀手锏功能类似于集群化之类的,都是付费版本才有的,且其维护基于单一的商业公司(言下之意,如果你不用商业版,其实InfluxDB也没什么特别大的优势,而且还是单一公司维护有风险)
- Graphite和Prometheus比起来,Prometheus的功能更丰富更强大
2.2 优势
在docker hub的介绍页面上,有一段优势描述:
多维度的数据模型(由metric名字定义的时序,以及一系列键值对的维度)灵活的查询语言来利用这些维度- 无依赖的分布式存储;
自治的单个服务器节点 - 时序数据采集使用基于HTTP的
拉模式 - 利用中间网关来支持
推送时序数据 - 监控目标的发现是通过
服务发现或静态配置 - 多种模式的
图像及报表支持 - 支持分层和水平的
联邦集群(federation)
3. 基础 & 日常使用
3.1 资源 & 安装
Prometheus的官方网站:https://prometheus.io/。
安装一般可以直接根据平台下载,Go应用程序的好处就显示出来了,只要一个可执行文件就能运行:https://prometheus.io/download/。
一般来说入门只需要:
- prometheus:本体
- node_exporter:最基本的exporter
使用help放在附录:prometheus -h。
3.2 概念
Prometheus的基本概念不算多,但如果不了解的话,看后面的东西会有障碍,因此建议先把概念了解清楚。
这里先给出一个简单的exporter吐出来的数据范例:
# HELP node_cpu Seconds the cpus spent in each mode.
# TYPE node_cpu counter
node_cpu{cpu="cpu0",mode="idle"} 362812.7890625
# HELP node_load1 1m load average.
# TYPE node_load1 gauge
node_load1 3.0703125Prometheus是一个时序数据库,何谓时序数据库,所有保存在Prometheus里的数据都是按时间戳和值的序列顺序存放的,这被称为Vector(向量)。
Prometheus的数据采集,每一个Metrics(指标)都会有两行以#字符起始的文本作为开头:
- 其中第一行是
注释:# HELP ...,主要用来说明该指标是什么 - 第二行是
定义:# TYPE ...,对当前的指标进行命名:node_load1,及类型的定义:gauge
除了名字之外,每一个指标都可以有一系列的Labels(标签)来描述更细致的维度:{cpu="cpu0",mode="idle"}。
每一次数据采集获得到的即一个Sample(样本),其由三部分组成:
- Metrics(指标):包含了Metrics name以及Labels
- Timestamp(时间戳):当前采样的时间,精度到毫秒
- Value(采样值):其类型为float64浮点数
e.g
<--------------- metric ---------------------><-timestamp -><-value->
http_request_total{status="200", method="GET"}@1434417560938 => 94355
http_request_total{status="200", method="GET"}@1434417561287 => 94334

http_request_total{status="404", method="GET"}@1434417560938 => 38473
http_request_total{status="404", method="GET"}@1434417561287 => 38544

http_request_total{status="200", method="POST"}@1434417560938 => 4748
http_request_total{status="200", method="POST"}@1434417561287 => 4785在Prometheus内部有一个预定义的变量__name__用来表达Metrics name(这里注意,该值只是名字,不含Label),在后续编程及配置文件处理的时候会用得到:
api_http_requests_total{method="POST", handler="/messages"}
=
{__name__="api_http_requests_total",method="POST", handler="/messages"}Prometheus服务器启动的时候,可以设置从很多端点(endpoint)进行数据采集。比如说:我们有一个主机,主机上运行了3个Go程序,一个Java程序,以及一个数据库。那么我们采集的时候就需要运行6个工作:主机采集、Go采集*3、Java采集、数据库采集。这6个工作,每一个我们都称之为:Job。Job可以自由设置采集的IP、端口以及endpoint,因此其自由度相当高,可以采集同服务器的不同服务,也可以采集不同的服务器上的数据,最终都汇总到一台Prometheus服务器上。
资料:
3.3 Metrics Type
Prometheus定义了4中不同的Metrics Type(指标类型):
- Counter(计数器):只增不减的计数器
- Gauge(仪表盘):可增可减的仪表盘
- Histogram(直方图):数据分布情况
- Summary(摘要):数据分布情况
最后的两个有点类似,区别在于Histogram描述的是绝对值,而Summary描述的是百分比。
e.g
# HELP prometheus_tsdb_compaction_chunk_range Final time range of chunks on their first compaction
# TYPE prometheus_tsdb_compaction_chunk_range histogram
prometheus_tsdb_compaction_chunk_range_bucket{le="100"} 0
prometheus_tsdb_compaction_chunk_range_bucket{le="400"} 0
prometheus_tsdb_compaction_chunk_range_bucket{le="1600"} 0
prometheus_tsdb_compaction_chunk_range_bucket{le="6400"} 0
prometheus_tsdb_compaction_chunk_range_bucket{le="25600"} 0
prometheus_tsdb_compaction_chunk_range_bucket{le="102400"} 0
prometheus_tsdb_compaction_chunk_range_bucket{le="409600"} 0
prometheus_tsdb_compaction_chunk_range_bucket{le="1.6384e+06"} 260
prometheus_tsdb_compaction_chunk_range_bucket{le="6.5536e+06"} 780
prometheus_tsdb_compaction_chunk_range_bucket{le="2.62144e+07"} 780
prometheus_tsdb_compaction_chunk_range_bucket{le="+Inf"} 780
prometheus_tsdb_compaction_chunk_range_sum 1.1540798e+09
prometheus_tsdb_compaction_chunk_range_count 780
# HELP prometheus_tsdb_wal_fsync_duration_seconds Duration of WAL fsync.
# TYPE prometheus_tsdb_wal_fsync_duration_seconds summary
prometheus_tsdb_wal_fsync_duration_seconds{quantile="0.5"} 0.012352463
prometheus_tsdb_wal_fsync_duration_seconds{quantile="0.9"} 0.014458005
prometheus_tsdb_wal_fsync_duration_seconds{quantile="0.99"} 0.017316173
prometheus_tsdb_wal_fsync_duration_seconds_sum 2.888716127000002
prometheus_tsdb_wal_fsync_duration_seconds_count 2163.4 Exporter
官方文档:EXPORTERS AND INTEGRATIONS。以及中文:第4章 Exporter详解。
Prometheus的设计是Prometheus服务器进行拉操作,而受监控对象则将时序数据吐出来给服务器。为了不影响受监控的应用程序本身,一般是用Sidecar设计,在应用程序之外进行数据的吐出,也就是Exporter这个角色(应用程序)。当然,如果需要直接在当前应用程序中进行数据暴露也是可以的,直接使用一些类库引入到应用程序中即可。
Prometheus流行起来之后,主流的应用程序一般都有对应的Exporter,直接下载使用即可。这里要提一下node_exporter,因为它是针对主机进行监控,因此不建议运行在容器里。容器本身就是和主机进行隔离的,运行在容器之中的话node_exporter无法很好工作。
这里需要注意的点是:信息的过滤。
Prometheus的特性是,只要你在配置文件中将某个Exporter设定为Prometheus定时抓取的对象,Prometheus就会将这个Exporter吐出的所有数据都定期采集起来,保存到时序数据库中。而实际情况则是,某个Exporter吐出来的数据中有很大一部分其实是我们并不关心的。
举个例子,Go语言的Exporter会吐出GC、内存、CPU、Goroutine等等一系列数据,而我们可能只关心GC、内存,其他都不关心。这个时候如果还是按默认的行为来进行采集的话,时序数据库里就会有很多无意义(我们不关心)的数据。为了防止这样的情况发生,有两种做法:
- 在启动Exporter的时候将部分指标过滤掉,直接不吐出来
- 在Prometheus配置文件中针对采集的Job进行
3.4.1 Exporter 过滤
举个例子,node_exporter在MAC上启动,默认会吐出如下数据:
INFO[0000] Enabled collectors:                           source="node_exporter.go:90"
INFO[0000]  - boottime                                   source="node_exporter.go:97"
INFO[0000]  - cpu                                        source="node_exporter.go:97"
INFO[0000]  - diskstats                                  source="node_exporter.go:97"
INFO[0000]  - filesystem                                 source="node_exporter.go:97"
INFO[0000]  - loadavg                                    source="node_exporter.go:97"
INFO[0000]  - meminfo                                    source="node_exporter.go:97"
INFO[0000]  - netdev                                     source="node_exporter.go:97"
INFO[0000]  - textfile                                   source="node_exporter.go:97"
INFO[0000] - time source="node_exporter.go:97"我们就可以在启动的时候附加:--no-collector.timeoption(time可置换成其他的),让其不再吐出,当然也可以添加option(—collector.xxx)吐出某些我们需要但默认不开启的数据。不同的Exporter设置可能会有些微不同,建议使用的时候仔细查看其手册。
这样的设计模式其实是有问题的,在使用的时候需要大量设置,用起来过于复杂:Question: Disable all collectors?。
3.4.2 metric_relabel_configs 过滤
官方文档在:<metric_relabel_configs>。讲解可以看一篇英语的:Prometheus relabeling tricks。
这个配置项的作用主要有几点:
- 在入库之前去掉不需要的指标
- 将入库的某些指标重新命名(这点很有用,后面会说到)
该配置项的效果会在数据入库之前生效,因此非常有用,可以显著减少入库的数据量,减少磁盘的容量占用,加快数据查询。
e.g
metric_relabel_configs:
  - source_labels: [__name__]
    regex: "(\
      go_gc_duration_seconds|\
      ...|\
      node_memory_wired_bytes\
    )"
action: drop上面的例子里使用了字符串换行,这里需要注意的是需要换行的字符串一定要使用双引号",双引号里的字符是不会被转译的,换行符\也就不会失效了。不换行的话,写法是:
regex: "(filtered1|filtered2|filtered3)"
总而言之,在数据过滤方面,Prometheus做的真的不好,无论是在Exporter端做过滤还是在配置文件里做过滤,都需要写不少过滤条目,蛮麻烦的。
3.5 配置文件
官方文档:CONFIGURATION。有一篇中文的译文不错,但不是太全:Prometheus的安装和配置。
配置文件这块,官方的文档细节肯定是最全的,有很多不常用的选项之类的,估计一般也只有官方文档里才找得到。不过官方文档就像我一开始说的,讲解得实在是,光有细节没有脑子。因此建议看一些范例,对配置文件有一个大概的了解之后再去官方文档里查细节会比较好。
主要的配置大项有:
- 抓取配置 scrape_configs
- 规则配置 recording_rules 中文
- 告警配置 alerting_rules
3.6 PromQL
Prometheus这块的设计应该说还算是比较可读的,可以看下中文book里的内容:
3.7 告警
Prometheus里的告警功能做得非常强大,按规则的组合可以轻松对告警进行规则定义、分组,并可以使用Altermanager进行对应的告警行为。当然使用上就有点复杂,需要花点时间梳理下。具体的细节可以查看:第3章 Prometheus告警处理。
3.8 Graph
3.8.1 Console Template
Prometheus的服务器有提供集成的图像化解决方案,这被称为:Console Template,其实无非就是一个模板引擎然后向其中填充数据。上手还是需要花点时间稍微摸索下,具体的细节可以查看:使用Console Template。
3.8.2 Grafana
现在比较主流的图像化做法是数据采集和存储由Prometheus来,然后图像化输出则由Grafana来处理。这块后面会在Grafana的专题里进行讲解。
3.9 存储
3.9.1 本地存储
Prometheus的时序数据库默认是存储在本地磁盘的,以2小时时间长度为分段,将数据存储到一个Block(块)中。具体的细节可以查看:本地存储。
3.9.2 远程存储
本地存储在可用性及高效性上有先天优势,但也有很多问题,最主要的就是本地磁盘的容量问题,本地磁盘容量不足就不能够保存长期数据。因此Prometheus也提供了远程写和远程读的设置,允许开发者将时序数据库的数据存储在远程介质中。具体的细节可以查看:远程存储。
3.10 重复的Metrics name
有一个比较常见的麻烦问题是:在同一个Prometheus服务器节点上,可能会采集到大量重名的指标。
这里举个例子来说:同一台Linux服务器节点上,有3个Go应用程序在运行,而我们需要把这三个应用程序的Go相关指标都监控起来。这时候你会发现采集上来的3份Go指标数据,其指标名都是重复的。这很正常,因为采集的指标都是同样的东西,只不过吐出数据的应用程序不同而已。
这时候我们就需要用到之前提到过的:metric_relabel_configs。每个Go应用程序肯定是在Prometheus服务器上设置成单独的Jobs,而这些不同的Jobs就需要设置各自的metric_relabel_configs,将获取到的同名指标重命名成和应用程序相关的指标,当然指标名的意义需要保持不变。
e.g
- job_name: cadvisor
  ...
  metric_relabel_configs:
  - source_labels: [image]
    regex: '.*/(.*)'
    replacement: '$1'
    target_label: id
  - source_labels: [service]
    regex: 'ecs-.*:ecs-([a-z]+-*[a-z]*).*:[0-9]+'
    replacement: '$1'
    target_label: service
4. 架构设计
4.1 架构图
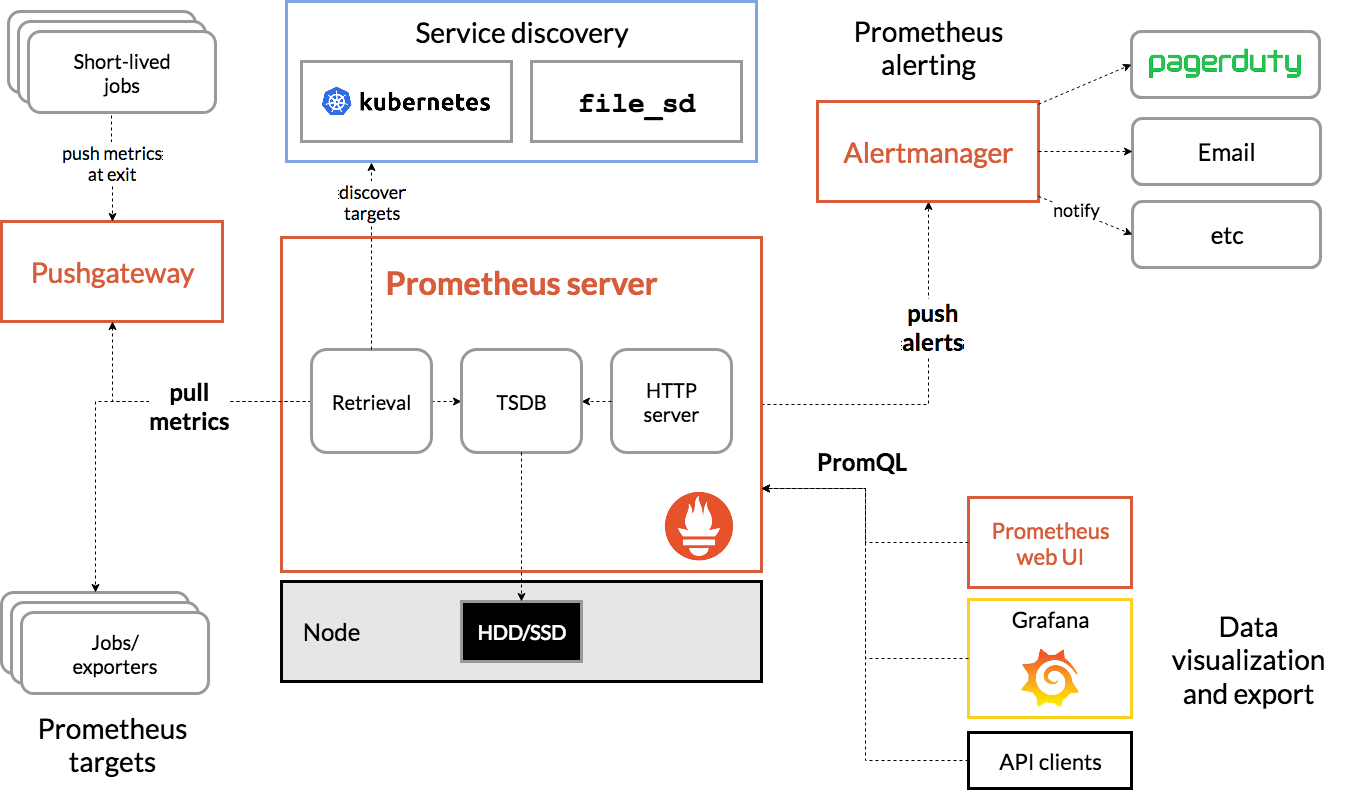
Prometheus的设计理念就是保证单节点的性能、功能完整性以及单节点的使用便利性。在这个理念下,Prometheus的使用是一件很简单的事情,稍微做点配置调整就可以使用了,而且这个节点上的所有数据都是存储在其本身的物理磁盘上的(有选项可以远程存储,这里按下不表),保证了不会有跨物理节点的各种问题。
4.2 集群化
Prometheus将单个节点做到极致的设计理念无疑是非常出色的,但万事都没有银弹。
- 整体的集群庞大到一定程度之后(全局的监控需求)
- 单个服务的集群扩展到一定程度(单服务的监控需求)
- 跨机房监控需求(单个机房单个Prometheus服务器,但需要有一个跳脱实例机房的节点进行overview)
在这些情况下,单个节点的Prometheus可能就无法胜任了。这时候必然就需要进行水平扩展或引入分布式集群的概念。
4.3 联邦集群 federation
联邦集群是官方提供的Prometheus唯一的集群解决方案。这个名词听上去有点玄乎,其实简单来说:
- 联邦集群中的Prometheus节点是分层级的
- 下级的Prometheus节点采集应用数据
- 上级的Prometheus节点从下级的Prometheus节点上采集数据
有几点需要注意:
- 下级Prometheus默认在
/federateendpoint暴露联邦集群的数据采集点,不需要配置 - 上级Prometheus必须在配置文件里指定
params:'match[]':- '{__name__=~"node_.*"}'这样的采集规则才能真正采集到数据,这方面的行为模式和Prometheus的默认模式是不一样的;默认情况下Prometheus会将暴露出来的所有数据都采集起来,但联邦集群的时候如果上级节点不指定采集的过滤参数的话,默认是什么都不采集(可能考虑到量级会有问题),因此必须手动在配置文件里进行指标名(可以组合标签)的过滤
说穿了其实所谓的联邦集群也没什么内容,无非就是在启动的Prometheus节点上默认开了个/federateendpoint,允许其他Prometheus从它这里拉取数据。至于联邦集群怎么组建,能玩出什么花来,Prometheus就不管了,让搭建者自己发挥。
4.4 高可用
简单的结论是:Prometheus并不存在高可用的解决方案。
官方现在的设计是将单节点的Prometheus做好,并提供联邦集群这个解决方案让用户自己去组建自己的监控拓扑网络。这在规模比较小的时候还算能对付,但在真正规模大起来之后就很容易出错了,维护者必须很清楚联邦集群里每一个节点负责的业务内容是什么,然后各层级节点如何对应汇集数据,这非常考验整个拓扑结构的搭建者的功力,以及维护的流程和工具。
Prometheus当前的集群设计给我的感觉有点类似于:3.0版本之前的redis的第三方集群解决方案 与 3.0版本之后redis官方提供的集群解决方案 之间的关系。你不能说第三方做的集群解决方案不能用,但和3.0之后官方集群方案提供的高可用相比之下,不得不说就不是一个档次上的了。
希望今后的Prometheus能在这方面发力。当然可能在组合了K8S之后,联邦集群也够用了,这方面我还没尝试过,就不做判断了。
这篇可以好好看下:Prometheus高可用。
5. Prometheus监控指标
Prometheus对自身的指标也有直接暴露,默认是放在:http://url_of_prometheus_server/metrics。
附录里我放了一份指标,可以研究下:prometheus/metrics。对于Prometheus自身的监控也是必要的。
6. 范例
实际的可运行范例可以查看:dist-system-practice/experiment/prometheus/federation/。
7. Docker实践
Prometheus在容器内运行有些难点,主要是配置上的,官方不支持在env中覆写配置文件中的内容,只允许使用bind mount的方式将配置文件加载进容器:Support for environment variable substitution in configuration file #2357。
这样一来所有的配置就必须使用配置文件的方式来生效,对于需要动态运行以及容器内集群支持的部署者来说就非常不友好,但官方维护者比较独裁,也没什么办法。
可运行范例参见:dist-system-practice/conf/dev/prometheus-cluster.yaml。
8. 常用监控
8.1 Prometheus
Prometheus自带metrics输出,自己采集自己即可,当然也可以用一个节点的prometheus将整个集群的metrics都采集起来。Grafana这边有一个2.0的Dashboard可以开箱即用,非常方便:Prometheus 2.0 Overview。
8.2 Host Machine
主机监控需要使用node_exporter:
- 代码:prometheus/node_exporter
- 镜像:prom/node-exporter
- prom/node-exporter:v0.17.0
问题:
- 之前提到过,指标默认基本上全部都开启并输出,如果需要过滤部分非常麻烦:Question: Disable all collectors?
- 不同的操作系统指标名不同,exporter直接将系统的指标名输出出来,因此不同系统还不同,且官方目前来看没有意愿进行抽象统一:Weird Memory Readings on macOS #855
Grafana Dashboard:1 Node Exporter 0.16—0.18 for Prometheus 监控展示看板
depends: grafana-cli plugins install grafana-piechart-panel
8.3 Memcached
- Exporter代码:prometheus/memcached_exporter
- Exporter镜像:prom/memcached-exporter
- prom/memcached-exporter:v0.5.0
- Dashboard:Prometheus memcached
8.4 JMX Exporter
官方介绍:
JMX to Prometheus exporter: a collector that can configurably scrape and expose mBeans of a JMX target.
This exporter is intended to be run as a Java Agent, exposing a HTTP server and serving metrics of the local JVM. It can be also run as an independent HTTP server and scrape remote JMX targets, but this has various disadvantages, such as being harder to configure and being unable to expose process metrics (e.g., memory and CPU usage). Running the exporter as a Java Agent is thus strongly encouraged.
大部分以JAVA为runtime的应用程序在进行监控的时候都需要使用到这个组件,因此使用频度还是相当高的。
- Exporter代码:prometheus/jmx_exporter
- Exporter镜像:sscaling/jmx-prometheus-exporter
- sscaling/jmx-prometheus-exporter:0.11.0
- Dashboard:通用的dashboard在这里比较没意义,因为使用java作为runtime的应用程序可能是web、可能是存储,多种多样,使用时需要根据应用程序进行适配的dashboard查找
9. TODO
囿于当前使用的深度及项目调研的时间限制,有部分内容做的还不够深入,后续可以考虑补全:
- Prometheus自身的Metrics深入研究,以便将Prometheus自身也纳入监控
- Prometheus的Benchmark
- PromQL深入理解
- 聚合操作:PromQL聚合操作 & OPERATORS
- 内置函数:PromQL内置函数 & FUNCTIONS
- 常用Exporter及其指标含义 及 实际可用的指标公式换算
资料
链接
- prometheus-book
- Instant vector selectors
- What’s in a __name__?
- Question: Disable all collectors?
- Prometheus relabeling tricks
- Prometheus的安装和配置
- Prometheus监控Kubernetes系列1——监控框架
- Prometheus监控Kubernetes系列2——监控部署
- Prometheus监控Kubernetes系列3——业务指标采集
prometheus/metrics {#ID_APP_SELF_METRICS}
# HELP net_conntrack_dialer_conn_attempted_total Total number of connections attempted by the given dialer a given name.
# TYPE net_conntrack_dialer_conn_attempted_total counter
net_conntrack_dialer_conn_attempted_total{dialer_name="federate"} 3 # 这里的dialer_name其实就是job名字
# HELP net_conntrack_dialer_conn_closed_total Total number of connections closed which originated from the dialer of a given name.
# TYPE net_conntrack_dialer_conn_closed_total counter
...
# HELP net_conntrack_dialer_conn_established_total Total number of connections successfully established by the given dialer a given name.
# TYPE net_conntrack_dialer_conn_established_total counter
...
# HELP net_conntrack_dialer_conn_failed_total Total number of connections failed to dial by the dialer a given name.
# TYPE net_conntrack_dialer_conn_failed_total counter
... # 这里的label:{dialer_name="federate",reason="refused|resolution|timeout|unknown"}
# HELP net_conntrack_listener_conn_accepted_total Total number of connections opened to the listener of a given name.
# TYPE net_conntrack_listener_conn_accepted_total counter
net_conntrack_listener_conn_accepted_total{listener_name="http"} 124
# HELP net_conntrack_listener_conn_closed_total Total number of connections closed that were made to the listener of a given name.
# TYPE net_conntrack_listener_conn_closed_total counter
net_conntrack_listener_conn_closed_total{listener_name="http"} 122
# HELP prometheus_api_remote_read_queries The current number of remote read queries being executed or waiting.
# TYPE prometheus_api_remote_read_queries gauge
prometheus_api_remote_read_queries 0
# HELP prometheus_build_info A metric with a constant '1' value labeled by version, revision, branch, and goversion from which prometheus was built.
# TYPE prometheus_build_info gauge
prometheus_build_info{branch="HEAD",goversion="go1.11.6",revision="4d60eb36dcbed725fcac5b27018574118f12fffb",version="2.8.1"} 1
# HELP prometheus_config_last_reload_success_timestamp_seconds Timestamp of the last successful configuration reload.
# TYPE prometheus_config_last_reload_success_timestamp_seconds gauge
prometheus_config_last_reload_success_timestamp_seconds 1.5547790627954009e+09
# HELP prometheus_config_last_reload_successful Whether the last configuration reload attempt was successful.
# TYPE prometheus_config_last_reload_successful gauge
prometheus_config_last_reload_successful 1
# HELP prometheus_engine_queries The current number of queries being executed or waiting.
# TYPE prometheus_engine_queries gauge
prometheus_engine_queries 0
# HELP prometheus_engine_queries_concurrent_max The max number of concurrent queries.
# TYPE prometheus_engine_queries_concurrent_max gauge
prometheus_engine_queries_concurrent_max 20
# HELP prometheus_engine_query_duration_seconds Query timings
# TYPE prometheus_engine_query_duration_seconds summary
prometheus_engine_query_duration_seconds{slice="inner_eval",quantile="0.5"} NaN
prometheus_engine_query_duration_seconds{slice="inner_eval",quantile="0.9"} NaN
prometheus_engine_query_duration_seconds{slice="inner_eval",quantile="0.99"} NaN
prometheus_engine_query_duration_seconds_sum{slice="inner_eval"} 2.2003e-05
... prepare_time | queue_time | result_sort
# HELP prometheus_http_request_duration_seconds Histogram of latencies for HTTP requests.
# TYPE prometheus_http_request_duration_seconds histogram
prometheus_http_request_duration_seconds_bucket{handler="/api/v1/label/:name/values",le="0.1"} 1
prometheus_http_request_duration_seconds_bucket{handler="/api/v1/label/:name/values",le="0.2"} 1
prometheus_http_request_duration_seconds_bucket{handler="/api/v1/label/:name/values",le="0.4"} 1
prometheus_http_request_duration_seconds_bucket{handler="/api/v1/label/:name/values",le="1"} 1
prometheus_http_request_duration_seconds_bucket{handler="/api/v1/label/:name/values",le="3"} 1
prometheus_http_request_duration_seconds_bucket{handler="/api/v1/label/:name/values",le="8"} 1
prometheus_http_request_duration_seconds_bucket{handler="/api/v1/label/:name/values",le="20"} 1
prometheus_http_request_duration_seconds_bucket{handler="/api/v1/label/:name/values",le="60"} 1
prometheus_http_request_duration_seconds_bucket{handler="/api/v1/label/:name/values",le="120"} 1
prometheus_http_request_duration_seconds_bucket{handler="/api/v1/label/:name/values",le="+Inf"} 1
prometheus_http_request_duration_seconds_sum{handler="/api/v1/label/:name/values"} 0.000778872
prometheus_http_request_duration_seconds_count{handler="/api/v1/label/:name/values"} 1
... /api/v1/query | /graph | /static/*filepath | /targets
# HELP prometheus_http_response_size_bytes Histogram of response size for HTTP requests.
# TYPE prometheus_http_response_size_bytes histogram
prometheus_http_response_size_bytes_bucket{handler="/api/v1/label/:name/values",le="100"} 0
prometheus_http_response_size_bytes_bucket{handler="/api/v1/label/:name/values",le="1000"} 1
prometheus_http_response_size_bytes_bucket{handler="/api/v1/label/:name/values",le="10000"} 1
prometheus_http_response_size_bytes_bucket{handler="/api/v1/label/:name/values",le="100000"} 1
prometheus_http_response_size_bytes_bucket{handler="/api/v1/label/:name/values",le="1e+06"} 1
prometheus_http_response_size_bytes_bucket{handler="/api/v1/label/:name/values",le="1e+07"} 1
prometheus_http_response_size_bytes_bucket{handler="/api/v1/label/:name/values",le="1e+08"} 1
prometheus_http_response_size_bytes_bucket{handler="/api/v1/label/:name/values",le="1e+09"} 1
prometheus_http_response_size_bytes_bucket{handler="/api/v1/label/:name/values",le="+Inf"} 1
prometheus_http_response_size_bytes_sum{handler="/api/v1/label/:name/values"} 293
prometheus_http_response_size_bytes_count{handler="/api/v1/label/:name/values"} 1
... /api/v1/query | /graph | /static/*filepath | /targets
# HELP prometheus_notifications_alertmanagers_discovered The number of alertmanagers discovered and active.
# TYPE prometheus_notifications_alertmanagers_discovered gauge
prometheus_notifications_alertmanagers_discovered 0
# HELP prometheus_notifications_dropped_total Total number of alerts dropped due to errors when sending to Alertmanager.
# TYPE prometheus_notifications_dropped_total counter
prometheus_notifications_dropped_total 0
# HELP prometheus_notifications_queue_capacity The capacity of the alert notifications queue.
# TYPE prometheus_notifications_queue_capacity gauge
prometheus_notifications_queue_capacity 10000
# HELP prometheus_notifications_queue_length The number of alert notifications in the queue.
# TYPE prometheus_notifications_queue_length gauge
prometheus_notifications_queue_length 0
# HELP prometheus_remote_storage_highest_timestamp_in_seconds Highest timestamp that has come into the remote storage via the Appender interface, in seconds since epoch.
# TYPE prometheus_remote_storage_highest_timestamp_in_seconds gauge
prometheus_remote_storage_highest_timestamp_in_seconds 1.554792751e+09
# HELP prometheus_remote_storage_samples_in_total Samples in to remote storage, compare to samples out for queue managers.
# TYPE prometheus_remote_storage_samples_in_total counter
prometheus_remote_storage_samples_in_total 123185
# HELP prometheus_rule_evaluation_duration_seconds The duration for a rule to execute.
# TYPE prometheus_rule_evaluation_duration_seconds summary
prometheus_rule_evaluation_duration_seconds{quantile="0.5"} NaN
prometheus_rule_evaluation_duration_seconds{quantile="0.9"} NaN
prometheus_rule_evaluation_duration_seconds{quantile="0.99"} NaN
prometheus_rule_evaluation_duration_seconds_sum 0
prometheus_rule_evaluation_duration_seconds_count 0
# HELP prometheus_rule_evaluation_failures_total The total number of rule evaluation failures.
# TYPE prometheus_rule_evaluation_failures_total counter
prometheus_rule_evaluation_failures_total 0
# HELP prometheus_rule_evaluations_total The total number of rule evaluations.
# TYPE prometheus_rule_evaluations_total counter
prometheus_rule_evaluations_total 0
# HELP prometheus_rule_group_duration_seconds The duration of rule group evaluations.
# TYPE prometheus_rule_group_duration_seconds summary
prometheus_rule_group_duration_seconds{quantile="0.01"} NaN
prometheus_rule_group_duration_seconds{quantile="0.05"} NaN
prometheus_rule_group_duration_seconds{quantile="0.5"} NaN
prometheus_rule_group_duration_seconds{quantile="0.9"} NaN
prometheus_rule_group_duration_seconds{quantile="0.99"} NaN
prometheus_rule_group_duration_seconds_sum 0
prometheus_rule_group_duration_seconds_count 0
# HELP prometheus_rule_group_iterations_missed_total The total number of rule group evaluations missed due to slow rule group evaluation.
# TYPE prometheus_rule_group_iterations_missed_total counter
prometheus_rule_group_iterations_missed_total 1
# HELP prometheus_rule_group_iterations_total The total number of scheduled rule group evaluations, whether executed or missed.
# TYPE prometheus_rule_group_iterations_total counter
prometheus_rule_group_iterations_total 0
# HELP prometheus_sd_azure_refresh_duration_seconds The duration of a Azure-SD refresh in seconds.
# TYPE prometheus_sd_azure_refresh_duration_seconds summary
prometheus_sd_azure_refresh_duration_seconds{quantile="0.5"} NaN
prometheus_sd_azure_refresh_duration_seconds{quantile="0.9"} NaN
prometheus_sd_azure_refresh_duration_seconds{quantile="0.99"} NaN
prometheus_sd_azure_refresh_duration_seconds_sum 0
prometheus_sd_azure_refresh_duration_seconds_count 0
# HELP prometheus_sd_azure_refresh_failures_total Number of Azure-SD refresh failures.
# TYPE prometheus_sd_azure_refresh_failures_total counter
prometheus_sd_azure_refresh_failures_total 0
# HELP prometheus_sd_consul_rpc_duration_seconds The duration of a Consul RPC call in seconds.
# TYPE prometheus_sd_consul_rpc_duration_seconds summary
prometheus_sd_consul_rpc_duration_seconds{call="service",endpoint="catalog",quantile="0.5"} NaN
prometheus_sd_consul_rpc_duration_seconds{call="service",endpoint="catalog",quantile="0.9"} NaN
prometheus_sd_consul_rpc_duration_seconds{call="service",endpoint="catalog",quantile="0.99"} NaN
prometheus_sd_consul_rpc_duration_seconds_sum{call="service",endpoint="catalog"} 0
prometheus_sd_consul_rpc_duration_seconds_count{call="service",endpoint="catalog"} 0
prometheus_sd_consul_rpc_duration_seconds{call="services",endpoint="catalog",quantile="0.5"} NaN
prometheus_sd_consul_rpc_duration_seconds{call="services",endpoint="catalog",quantile="0.9"} NaN
prometheus_sd_consul_rpc_duration_seconds{call="services",endpoint="catalog",quantile="0.99"} NaN
prometheus_sd_consul_rpc_duration_seconds_sum{call="services",endpoint="catalog"} 0
prometheus_sd_consul_rpc_duration_seconds_count{call="services",endpoint="catalog"} 0
# HELP prometheus_sd_consul_rpc_failures_total The number of Consul RPC call failures.
# TYPE prometheus_sd_consul_rpc_failures_total counter
prometheus_sd_consul_rpc_failures_total 0
# HELP prometheus_sd_discovered_targets Current number of discovered targets.
# TYPE prometheus_sd_discovered_targets gauge
prometheus_sd_discovered_targets{config="federate",name="scrape"} 3
# HELP prometheus_sd_dns_lookup_failures_total The number of DNS-SD lookup failures.
# TYPE prometheus_sd_dns_lookup_failures_total counter
prometheus_sd_dns_lookup_failures_total 0
# HELP prometheus_sd_dns_lookups_total The number of DNS-SD lookups.
# TYPE prometheus_sd_dns_lookups_total counter
prometheus_sd_dns_lookups_total 0
# HELP prometheus_sd_ec2_refresh_duration_seconds The duration of a EC2-SD refresh in seconds.
# TYPE prometheus_sd_ec2_refresh_duration_seconds summary
prometheus_sd_ec2_refresh_duration_seconds{quantile="0.5"} NaN
prometheus_sd_ec2_refresh_duration_seconds{quantile="0.9"} NaN
prometheus_sd_ec2_refresh_duration_seconds{quantile="0.99"} NaN
prometheus_sd_ec2_refresh_duration_seconds_sum 0
prometheus_sd_ec2_refresh_duration_seconds_count 0
# HELP prometheus_sd_ec2_refresh_failures_total The number of EC2-SD scrape failures.
# TYPE prometheus_sd_ec2_refresh_failures_total counter
prometheus_sd_ec2_refresh_failures_total 0
# HELP prometheus_sd_file_read_errors_total The number of File-SD read errors.
# TYPE prometheus_sd_file_read_errors_total counter
prometheus_sd_file_read_errors_total 0
# HELP prometheus_sd_file_scan_duration_seconds The duration of the File-SD scan in seconds.
# TYPE prometheus_sd_file_scan_duration_seconds summary
prometheus_sd_file_scan_duration_seconds{quantile="0.5"} NaN
prometheus_sd_file_scan_duration_seconds{quantile="0.9"} NaN
prometheus_sd_file_scan_duration_seconds{quantile="0.99"} NaN
prometheus_sd_file_scan_duration_seconds_sum 0
prometheus_sd_file_scan_duration_seconds_count 0
# HELP prometheus_sd_gce_refresh_duration The duration of a GCE-SD refresh in seconds.
# TYPE prometheus_sd_gce_refresh_duration summary
prometheus_sd_gce_refresh_duration{quantile="0.5"} NaN
prometheus_sd_gce_refresh_duration{quantile="0.9"} NaN
prometheus_sd_gce_refresh_duration{quantile="0.99"} NaN
prometheus_sd_gce_refresh_duration_sum 0
prometheus_sd_gce_refresh_duration_count 0
# HELP prometheus_sd_gce_refresh_failures_total The number of GCE-SD refresh failures.
# TYPE prometheus_sd_gce_refresh_failures_total counter
prometheus_sd_gce_refresh_failures_total 0
# HELP prometheus_sd_kubernetes_cache_last_resource_version Last resource version from the Kubernetes API.
# TYPE prometheus_sd_kubernetes_cache_last_resource_version gauge
prometheus_sd_kubernetes_cache_last_resource_version 0
# HELP prometheus_sd_kubernetes_cache_list_duration_seconds Duration of a Kubernetes API call in seconds.
# TYPE prometheus_sd_kubernetes_cache_list_duration_seconds summary
prometheus_sd_kubernetes_cache_list_duration_seconds_sum 0
prometheus_sd_kubernetes_cache_list_duration_seconds_count 0
# HELP prometheus_sd_kubernetes_cache_list_items Count of items in a list from the Kubernetes API.
# TYPE prometheus_sd_kubernetes_cache_list_items summary
prometheus_sd_kubernetes_cache_list_items_sum 0
prometheus_sd_kubernetes_cache_list_items_count 0
# HELP prometheus_sd_kubernetes_cache_list_total Total number of list operations.
# TYPE prometheus_sd_kubernetes_cache_list_total counter
prometheus_sd_kubernetes_cache_list_total 0
# HELP prometheus_sd_kubernetes_cache_short_watches_total Total number of short watch operations.
# TYPE prometheus_sd_kubernetes_cache_short_watches_total counter
prometheus_sd_kubernetes_cache_short_watches_total 0
# HELP prometheus_sd_kubernetes_cache_watch_duration_seconds Duration of watches on the Kubernetes API.
# TYPE prometheus_sd_kubernetes_cache_watch_duration_seconds summary
prometheus_sd_kubernetes_cache_watch_duration_seconds_sum 0
prometheus_sd_kubernetes_cache_watch_duration_seconds_count 0
# HELP prometheus_sd_kubernetes_cache_watch_events Number of items in watches on the Kubernetes API.
# TYPE prometheus_sd_kubernetes_cache_watch_events summary
prometheus_sd_kubernetes_cache_watch_events_sum 0
prometheus_sd_kubernetes_cache_watch_events_count 0
# HELP prometheus_sd_kubernetes_cache_watches_total Total number of watch operations.
# TYPE prometheus_sd_kubernetes_cache_watches_total counter
prometheus_sd_kubernetes_cache_watches_total 0
# HELP prometheus_sd_kubernetes_events_total The number of Kubernetes events handled.
# TYPE prometheus_sd_kubernetes_events_total counter
prometheus_sd_kubernetes_events_total{event="add",role="endpoints"} 0
prometheus_sd_kubernetes_events_total{event="add",role="ingress"} 0
prometheus_sd_kubernetes_events_total{event="add",role="node"} 0
prometheus_sd_kubernetes_events_total{event="add",role="pod"} 0
prometheus_sd_kubernetes_events_total{event="add",role="service"} 0
prometheus_sd_kubernetes_events_total{event="delete",role="endpoints"} 0
prometheus_sd_kubernetes_events_total{event="delete",role="ingress"} 0
prometheus_sd_kubernetes_events_total{event="delete",role="node"} 0
prometheus_sd_kubernetes_events_total{event="delete",role="pod"} 0
prometheus_sd_kubernetes_events_total{event="delete",role="service"} 0
prometheus_sd_kubernetes_events_total{event="update",role="endpoints"} 0
prometheus_sd_kubernetes_events_total{event="update",role="ingress"} 0
prometheus_sd_kubernetes_events_total{event="update",role="node"} 0
prometheus_sd_kubernetes_events_total{event="update",role="pod"} 0
prometheus_sd_kubernetes_events_total{event="update",role="service"} 0
# HELP prometheus_sd_marathon_refresh_duration_seconds The duration of a Marathon-SD refresh in seconds.
# TYPE prometheus_sd_marathon_refresh_duration_seconds summary
prometheus_sd_marathon_refresh_duration_seconds{quantile="0.5"} NaN
prometheus_sd_marathon_refresh_duration_seconds{quantile="0.9"} NaN
prometheus_sd_marathon_refresh_duration_seconds{quantile="0.99"} NaN
prometheus_sd_marathon_refresh_duration_seconds_sum 0
prometheus_sd_marathon_refresh_duration_seconds_count 0
# HELP prometheus_sd_marathon_refresh_failures_total The number of Marathon-SD refresh failures.
# TYPE prometheus_sd_marathon_refresh_failures_total counter
prometheus_sd_marathon_refresh_failures_total 0
# HELP prometheus_sd_openstack_refresh_duration_seconds The duration of an OpenStack-SD refresh in seconds.
# TYPE prometheus_sd_openstack_refresh_duration_seconds summary
prometheus_sd_openstack_refresh_duration_seconds{quantile="0.5"} NaN
prometheus_sd_openstack_refresh_duration_seconds{quantile="0.9"} NaN
prometheus_sd_openstack_refresh_duration_seconds{quantile="0.99"} NaN
prometheus_sd_openstack_refresh_duration_seconds_sum 0
prometheus_sd_openstack_refresh_duration_seconds_count 0
# HELP prometheus_sd_openstack_refresh_failures_total The number of OpenStack-SD scrape failures.
# TYPE prometheus_sd_openstack_refresh_failures_total counter
prometheus_sd_openstack_refresh_failures_total 0
# HELP prometheus_sd_received_updates_total Total number of update events received from the SD providers.
# TYPE prometheus_sd_received_updates_total counter
prometheus_sd_received_updates_total{name="scrape"} 2
# HELP prometheus_sd_triton_refresh_duration_seconds The duration of a Triton-SD refresh in seconds.
# TYPE prometheus_sd_triton_refresh_duration_seconds summary
prometheus_sd_triton_refresh_duration_seconds{quantile="0.5"} NaN
prometheus_sd_triton_refresh_duration_seconds{quantile="0.9"} NaN
prometheus_sd_triton_refresh_duration_seconds{quantile="0.99"} NaN
prometheus_sd_triton_refresh_duration_seconds_sum 0
prometheus_sd_triton_refresh_duration_seconds_count 0
# HELP prometheus_sd_triton_refresh_failures_total The number of Triton-SD scrape failures.
# TYPE prometheus_sd_triton_refresh_failures_total counter
prometheus_sd_triton_refresh_failures_total 0
# HELP prometheus_sd_updates_total Total number of update events sent to the SD consumers.
# TYPE prometheus_sd_updates_total counter
prometheus_sd_updates_total{name="scrape"} 1
# HELP prometheus_target_interval_length_seconds Actual intervals between scrapes.
# TYPE prometheus_target_interval_length_seconds summary
prometheus_target_interval_length_seconds{interval="15s",quantile="0.01"} 14.995180776
prometheus_target_interval_length_seconds{interval="15s",quantile="0.05"} 14.996111038
prometheus_target_interval_length_seconds{interval="15s",quantile="0.5"} 15.000072502
prometheus_target_interval_length_seconds{interval="15s",quantile="0.9"} 15.00274162
prometheus_target_interval_length_seconds{interval="15s",quantile="0.99"} 15.004418161
prometheus_target_interval_length_seconds_sum{interval="15s"} 41010.099564205055
prometheus_target_interval_length_seconds_count{interval="15s"} 2734
# HELP prometheus_target_scrape_pool_reloads_failed_total Total number of failed scrape loop reloads.
# TYPE prometheus_target_scrape_pool_reloads_failed_total counter
prometheus_target_scrape_pool_reloads_failed_total 0
# HELP prometheus_target_scrape_pool_reloads_total Total number of scrape loop reloads.
# TYPE prometheus_target_scrape_pool_reloads_total counter
prometheus_target_scrape_pool_reloads_total 0
# HELP prometheus_target_scrape_pool_sync_total Total number of syncs that were executed on a scrape pool.
# TYPE prometheus_target_scrape_pool_sync_total counter
prometheus_target_scrape_pool_sync_total{scrape_job="federate"} 1
# HELP prometheus_target_scrape_pools_failed_total Total number of scrape pool creations that failed.
# TYPE prometheus_target_scrape_pools_failed_total counter
prometheus_target_scrape_pools_failed_total 0
# HELP prometheus_target_scrape_pools_total Total number of scrape pool creation atttempts.
# TYPE prometheus_target_scrape_pools_total counter
prometheus_target_scrape_pools_total 1
# HELP prometheus_target_scrapes_exceeded_sample_limit_total Total number of scrapes that hit the sample limit and were rejected.
# TYPE prometheus_target_scrapes_exceeded_sample_limit_total counter
prometheus_target_scrapes_exceeded_sample_limit_total 0
# HELP prometheus_target_scrapes_sample_duplicate_timestamp_total Total number of samples rejected due to duplicate timestamps but different values
# TYPE prometheus_target_scrapes_sample_duplicate_timestamp_total counter
prometheus_target_scrapes_sample_duplicate_timestamp_total 0
# HELP prometheus_target_scrapes_sample_out_of_bounds_total Total number of samples rejected due to timestamp falling outside of the time bounds
# TYPE prometheus_target_scrapes_sample_out_of_bounds_total counter
prometheus_target_scrapes_sample_out_of_bounds_total 0
# HELP prometheus_target_scrapes_sample_out_of_order_total Total number of samples rejected due to not being out of the expected order
# TYPE prometheus_target_scrapes_sample_out_of_order_total counter
prometheus_target_scrapes_sample_out_of_order_total 0
# HELP prometheus_target_sync_length_seconds Actual interval to sync the scrape pool.
# TYPE prometheus_target_sync_length_seconds summary
prometheus_target_sync_length_seconds{scrape_job="federate",quantile="0.01"} NaN
prometheus_target_sync_length_seconds{scrape_job="federate",quantile="0.05"} NaN
prometheus_target_sync_length_seconds{scrape_job="federate",quantile="0.5"} NaN
prometheus_target_sync_length_seconds{scrape_job="federate",quantile="0.9"} NaN
prometheus_target_sync_length_seconds{scrape_job="federate",quantile="0.99"} NaN
prometheus_target_sync_length_seconds_sum{scrape_job="federate"} 0.000219783
prometheus_target_sync_length_seconds_count{scrape_job="federate"} 1
# HELP prometheus_template_text_expansion_failures_total The total number of template text expansion failures.
# TYPE prometheus_template_text_expansion_failures_total counter
prometheus_template_text_expansion_failures_total 0
# HELP prometheus_template_text_expansions_total The total number of template text expansions.
# TYPE prometheus_template_text_expansions_total counter
prometheus_template_text_expansions_total 0
# HELP prometheus_treecache_watcher_goroutines The current number of watcher goroutines.
# TYPE prometheus_treecache_watcher_goroutines gauge
prometheus_treecache_watcher_goroutines 0
# HELP prometheus_treecache_zookeeper_failures_total The total number of ZooKeeper failures.
# TYPE prometheus_treecache_zookeeper_failures_total counter
prometheus_treecache_zookeeper_failures_total 0
# HELP prometheus_tsdb_blocks_loaded Number of currently loaded data blocks
# TYPE prometheus_tsdb_blocks_loaded gauge
prometheus_tsdb_blocks_loaded 1
# HELP prometheus_tsdb_checkpoint_creations_failed_total Total number of checkpoint creations that failed.
# TYPE prometheus_tsdb_checkpoint_creations_failed_total counter
prometheus_tsdb_checkpoint_creations_failed_total 0
# HELP prometheus_tsdb_checkpoint_creations_total Total number of checkpoint creations attempted.
# TYPE prometheus_tsdb_checkpoint_creations_total counter
prometheus_tsdb_checkpoint_creations_total 0
# HELP prometheus_tsdb_checkpoint_deletions_failed_total Total number of checkpoint deletions that failed.
# TYPE prometheus_tsdb_checkpoint_deletions_failed_total counter
prometheus_tsdb_checkpoint_deletions_failed_total 0
# HELP prometheus_tsdb_checkpoint_deletions_total Total number of checkpoint deletions attempted.
# TYPE prometheus_tsdb_checkpoint_deletions_total counter
prometheus_tsdb_checkpoint_deletions_total 0
# HELP prometheus_tsdb_compaction_chunk_range_seconds Final time range of chunks on their first compaction
# TYPE prometheus_tsdb_compaction_chunk_range_seconds histogram
prometheus_tsdb_compaction_chunk_range_seconds_bucket{le="100"} 0
prometheus_tsdb_compaction_chunk_range_seconds_bucket{le="400"} 0
prometheus_tsdb_compaction_chunk_range_seconds_bucket{le="1600"} 0
prometheus_tsdb_compaction_chunk_range_seconds_bucket{le="6400"} 0
prometheus_tsdb_compaction_chunk_range_seconds_bucket{le="25600"} 0
prometheus_tsdb_compaction_chunk_range_seconds_bucket{le="102400"} 0
prometheus_tsdb_compaction_chunk_range_seconds_bucket{le="409600"} 0
prometheus_tsdb_compaction_chunk_range_seconds_bucket{le="1.6384e+06"} 0
prometheus_tsdb_compaction_chunk_range_seconds_bucket{le="6.5536e+06"} 147
prometheus_tsdb_compaction_chunk_range_seconds_bucket{le="2.62144e+07"} 147
prometheus_tsdb_compaction_chunk_range_seconds_bucket{le="+Inf"} 147
prometheus_tsdb_compaction_chunk_range_seconds_sum 4.53475943e+08
prometheus_tsdb_compaction_chunk_range_seconds_count 147
# HELP prometheus_tsdb_compaction_chunk_samples Final number of samples on their first compaction
# TYPE prometheus_tsdb_compaction_chunk_samples histogram
prometheus_tsdb_compaction_chunk_samples_bucket{le="4"} 0
prometheus_tsdb_compaction_chunk_samples_bucket{le="6"} 0
prometheus_tsdb_compaction_chunk_samples_bucket{le="9"} 0
prometheus_tsdb_compaction_chunk_samples_bucket{le="13.5"} 0
prometheus_tsdb_compaction_chunk_samples_bucket{le="20.25"} 0
prometheus_tsdb_compaction_chunk_samples_bucket{le="30.375"} 0
prometheus_tsdb_compaction_chunk_samples_bucket{le="45.5625"} 0
prometheus_tsdb_compaction_chunk_samples_bucket{le="68.34375"} 0
prometheus_tsdb_compaction_chunk_samples_bucket{le="102.515625"} 0
prometheus_tsdb_compaction_chunk_samples_bucket{le="153.7734375"} 24
prometheus_tsdb_compaction_chunk_samples_bucket{le="230.66015625"} 147
prometheus_tsdb_compaction_chunk_samples_bucket{le="345.990234375"} 147
prometheus_tsdb_compaction_chunk_samples_bucket{le="+Inf"} 147
prometheus_tsdb_compaction_chunk_samples_sum 30343
prometheus_tsdb_compaction_chunk_samples_count 147
# HELP prometheus_tsdb_compaction_chunk_size_bytes Final size of chunks on their first compaction
# TYPE prometheus_tsdb_compaction_chunk_size_bytes histogram
prometheus_tsdb_compaction_chunk_size_bytes_bucket{le="32"} 0
prometheus_tsdb_compaction_chunk_size_bytes_bucket{le="48"} 0
prometheus_tsdb_compaction_chunk_size_bytes_bucket{le="72"} 0
prometheus_tsdb_compaction_chunk_size_bytes_bucket{le="108"} 0
prometheus_tsdb_compaction_chunk_size_bytes_bucket{le="162"} 0
prometheus_tsdb_compaction_chunk_size_bytes_bucket{le="243"} 3
prometheus_tsdb_compaction_chunk_size_bytes_bucket{le="364.5"} 18
prometheus_tsdb_compaction_chunk_size_bytes_bucket{le="546.75"} 18
prometheus_tsdb_compaction_chunk_size_bytes_bucket{le="820.125"} 80
prometheus_tsdb_compaction_chunk_size_bytes_bucket{le="1230.1875"} 103
prometheus_tsdb_compaction_chunk_size_bytes_bucket{le="1845.28125"} 106
prometheus_tsdb_compaction_chunk_size_bytes_bucket{le="2767.921875"} 147
prometheus_tsdb_compaction_chunk_size_bytes_bucket{le="+Inf"} 147
prometheus_tsdb_compaction_chunk_size_bytes_sum 152382
prometheus_tsdb_compaction_chunk_size_bytes_count 147
# HELP prometheus_tsdb_compaction_duration_seconds Duration of compaction runs
# TYPE prometheus_tsdb_compaction_duration_seconds histogram
prometheus_tsdb_compaction_duration_seconds_bucket{le="1"} 0
prometheus_tsdb_compaction_duration_seconds_bucket{le="2"} 1
prometheus_tsdb_compaction_duration_seconds_bucket{le="4"} 1
prometheus_tsdb_compaction_duration_seconds_bucket{le="8"} 1
prometheus_tsdb_compaction_duration_seconds_bucket{le="16"} 1
prometheus_tsdb_compaction_duration_seconds_bucket{le="32"} 1
prometheus_tsdb_compaction_duration_seconds_bucket{le="64"} 1
prometheus_tsdb_compaction_duration_seconds_bucket{le="128"} 1
prometheus_tsdb_compaction_duration_seconds_bucket{le="256"} 1
prometheus_tsdb_compaction_duration_seconds_bucket{le="512"} 1
prometheus_tsdb_compaction_duration_seconds_bucket{le="+Inf"} 1
prometheus_tsdb_compaction_duration_seconds_sum 1.250883887
prometheus_tsdb_compaction_duration_seconds_count 1
# HELP prometheus_tsdb_compaction_populating_block Set to 1 when a block is currently being written to the disk.
# TYPE prometheus_tsdb_compaction_populating_block gauge
prometheus_tsdb_compaction_populating_block 0
# HELP prometheus_tsdb_compactions_failed_total Total number of compactions that failed for the partition.
# TYPE prometheus_tsdb_compactions_failed_total counter
prometheus_tsdb_compactions_failed_total 0
# HELP prometheus_tsdb_compactions_total Total number of compactions that were executed for the partition.
# TYPE prometheus_tsdb_compactions_total counter
prometheus_tsdb_compactions_total 1
# HELP prometheus_tsdb_compactions_triggered_total Total number of triggered compactions for the partition.
# TYPE prometheus_tsdb_compactions_triggered_total counter
prometheus_tsdb_compactions_triggered_total 228
# HELP prometheus_tsdb_head_active_appenders Number of currently active appender transactions
# TYPE prometheus_tsdb_head_active_appenders gauge
prometheus_tsdb_head_active_appenders 0
# HELP prometheus_tsdb_head_chunks Total number of chunks in the head block.
# TYPE prometheus_tsdb_head_chunks gauge
prometheus_tsdb_head_chunks 810
# HELP prometheus_tsdb_head_chunks_created_total Total number of chunks created in the head
# TYPE prometheus_tsdb_head_chunks_created_total counter
prometheus_tsdb_head_chunks_created_total 957
# HELP prometheus_tsdb_head_chunks_removed_total Total number of chunks removed in the head
# TYPE prometheus_tsdb_head_chunks_removed_total counter
prometheus_tsdb_head_chunks_removed_total 147
# HELP prometheus_tsdb_head_gc_duration_seconds Runtime of garbage collection in the head block.
# TYPE prometheus_tsdb_head_gc_duration_seconds summary
prometheus_tsdb_head_gc_duration_seconds{quantile="0.5"} NaN
prometheus_tsdb_head_gc_duration_seconds{quantile="0.9"} NaN
prometheus_tsdb_head_gc_duration_seconds{quantile="0.99"} NaN
prometheus_tsdb_head_gc_duration_seconds_sum 0.001884575
prometheus_tsdb_head_gc_duration_seconds_count 1
# HELP prometheus_tsdb_head_max_time Maximum timestamp of the head block. The unit is decided by the library consumer.
# TYPE prometheus_tsdb_head_max_time gauge
prometheus_tsdb_head_max_time 1.554792751194e+12
# HELP prometheus_tsdb_head_max_time_seconds Maximum timestamp of the head block.
# TYPE prometheus_tsdb_head_max_time_seconds gauge
prometheus_tsdb_head_max_time_seconds 1.554792751194e+09
# HELP prometheus_tsdb_head_min_time Minimum time bound of the head block. The unit is decided by the library consumer.
# TYPE prometheus_tsdb_head_min_time gauge
prometheus_tsdb_head_min_time 1.5547824e+12
# HELP prometheus_tsdb_head_min_time_seconds Minimum time bound of the head block.
# TYPE prometheus_tsdb_head_min_time_seconds gauge
prometheus_tsdb_head_min_time_seconds 1.5547824e+09
# HELP prometheus_tsdb_head_samples_appended_total Total number of appended samples.
# TYPE prometheus_tsdb_head_samples_appended_total counter
prometheus_tsdb_head_samples_appended_total 123185
# HELP prometheus_tsdb_head_series Total number of series in the head block.
# TYPE prometheus_tsdb_head_series gauge
prometheus_tsdb_head_series 135
# HELP prometheus_tsdb_head_series_created_total Total number of series created in the head
# TYPE prometheus_tsdb_head_series_created_total counter
prometheus_tsdb_head_series_created_total 135
# HELP prometheus_tsdb_head_series_not_found_total Total number of requests for series that were not found.
# TYPE prometheus_tsdb_head_series_not_found_total counter
prometheus_tsdb_head_series_not_found_total 0
# HELP prometheus_tsdb_head_series_removed_total Total number of series removed in the head
# TYPE prometheus_tsdb_head_series_removed_total counter
prometheus_tsdb_head_series_removed_total 0
# HELP prometheus_tsdb_head_truncations_failed_total Total number of head truncations that failed.
# TYPE prometheus_tsdb_head_truncations_failed_total counter
prometheus_tsdb_head_truncations_failed_total 0
# HELP prometheus_tsdb_head_truncations_total Total number of head truncations attempted.
# TYPE prometheus_tsdb_head_truncations_total counter
prometheus_tsdb_head_truncations_total 1
# HELP prometheus_tsdb_lowest_timestamp Lowest timestamp value stored in the database. The unit is decided by the library consumer.
# TYPE prometheus_tsdb_lowest_timestamp gauge
prometheus_tsdb_lowest_timestamp 1.55477867699e+12
# HELP prometheus_tsdb_lowest_timestamp_seconds Lowest timestamp value stored in the database.
# TYPE prometheus_tsdb_lowest_timestamp_seconds gauge
prometheus_tsdb_lowest_timestamp_seconds 1.55477867699e+09
# HELP prometheus_tsdb_reloads_failures_total Number of times the database failed to reload block data from disk.
# TYPE prometheus_tsdb_reloads_failures_total counter
prometheus_tsdb_reloads_failures_total 0
# HELP prometheus_tsdb_reloads_total Number of times the database reloaded block data from disk.
# TYPE prometheus_tsdb_reloads_total counter
prometheus_tsdb_reloads_total 2
# HELP prometheus_tsdb_size_retentions_total The number of times that blocks were deleted because the maximum number of bytes was exceeded.
# TYPE prometheus_tsdb_size_retentions_total counter
prometheus_tsdb_size_retentions_total 0
# HELP prometheus_tsdb_storage_blocks_bytes The number of bytes that are currently used for local storage by all blocks.
# TYPE prometheus_tsdb_storage_blocks_bytes gauge
prometheus_tsdb_storage_blocks_bytes 165474
# HELP prometheus_tsdb_symbol_table_size_bytes Size of symbol table on disk (in bytes)
# TYPE prometheus_tsdb_symbol_table_size_bytes gauge
prometheus_tsdb_symbol_table_size_bytes 1807
# HELP prometheus_tsdb_time_retentions_total The number of times that blocks were deleted because the maximum time limit was exceeded.
# TYPE prometheus_tsdb_time_retentions_total counter
prometheus_tsdb_time_retentions_total 0
# HELP prometheus_tsdb_tombstone_cleanup_seconds The time taken to recompact blocks to remove tombstones.
# TYPE prometheus_tsdb_tombstone_cleanup_seconds histogram
prometheus_tsdb_tombstone_cleanup_seconds_bucket{le="0.005"} 0
prometheus_tsdb_tombstone_cleanup_seconds_bucket{le="0.01"} 0
prometheus_tsdb_tombstone_cleanup_seconds_bucket{le="0.025"} 0
prometheus_tsdb_tombstone_cleanup_seconds_bucket{le="0.05"} 0
prometheus_tsdb_tombstone_cleanup_seconds_bucket{le="0.1"} 0
prometheus_tsdb_tombstone_cleanup_seconds_bucket{le="0.25"} 0
prometheus_tsdb_tombstone_cleanup_seconds_bucket{le="0.5"} 0
prometheus_tsdb_tombstone_cleanup_seconds_bucket{le="1"} 0
prometheus_tsdb_tombstone_cleanup_seconds_bucket{le="2.5"} 0
prometheus_tsdb_tombstone_cleanup_seconds_bucket{le="5"} 0
prometheus_tsdb_tombstone_cleanup_seconds_bucket{le="10"} 0
prometheus_tsdb_tombstone_cleanup_seconds_bucket{le="+Inf"} 0
prometheus_tsdb_tombstone_cleanup_seconds_sum 0
prometheus_tsdb_tombstone_cleanup_seconds_count 0
# HELP prometheus_tsdb_vertical_compactions_total Total number of compactions done on overlapping blocks.
# TYPE prometheus_tsdb_vertical_compactions_total counter
prometheus_tsdb_vertical_compactions_total 0
# HELP prometheus_tsdb_wal_completed_pages_total Total number of completed pages.
# TYPE prometheus_tsdb_wal_completed_pages_total counter
prometheus_tsdb_wal_completed_pages_total 42
# HELP prometheus_tsdb_wal_corruptions_total Total number of WAL corruptions.
# TYPE prometheus_tsdb_wal_corruptions_total counter
prometheus_tsdb_wal_corruptions_total 0
# HELP prometheus_tsdb_wal_fsync_duration_seconds Duration of WAL fsync.
# TYPE prometheus_tsdb_wal_fsync_duration_seconds summary
prometheus_tsdb_wal_fsync_duration_seconds{quantile="0.5"} NaN
prometheus_tsdb_wal_fsync_duration_seconds{quantile="0.9"} NaN
prometheus_tsdb_wal_fsync_duration_seconds{quantile="0.99"} NaN
prometheus_tsdb_wal_fsync_duration_seconds_sum 0
prometheus_tsdb_wal_fsync_duration_seconds_count 0
# HELP prometheus_tsdb_wal_page_flushes_total Total number of page flushes.
# TYPE prometheus_tsdb_wal_page_flushes_total counter
prometheus_tsdb_wal_page_flushes_total 5519
# HELP prometheus_tsdb_wal_truncate_duration_seconds Duration of WAL truncation.
# TYPE prometheus_tsdb_wal_truncate_duration_seconds summary
prometheus_tsdb_wal_truncate_duration_seconds{quantile="0.5"} NaN
prometheus_tsdb_wal_truncate_duration_seconds{quantile="0.9"} NaN
prometheus_tsdb_wal_truncate_duration_seconds{quantile="0.99"} NaN
prometheus_tsdb_wal_truncate_duration_seconds_sum 0
prometheus_tsdb_wal_truncate_duration_seconds_count 0
# HELP prometheus_tsdb_wal_truncations_failed_total Total number of WAL truncations that failed.
# TYPE prometheus_tsdb_wal_truncations_failed_total counter
prometheus_tsdb_wal_truncations_failed_total 0
# HELP prometheus_tsdb_wal_truncations_total Total number of WAL truncations attempted.
# TYPE prometheus_tsdb_wal_truncations_total counter
prometheus_tsdb_wal_truncations_total 0
# HELP promhttp_metric_handler_requests_in_flight Current number of scrapes being served.
# TYPE promhttp_metric_handler_requests_in_flight gauge
promhttp_metric_handler_requests_in_flight 1
# HELP promhttp_metric_handler_requests_total Total number of scrapes by HTTP status code.
# TYPE promhttp_metric_handler_requests_total counter
promhttp_metric_handler_requests_total{code="200"} 0
promhttp_metric_handler_requests_total{code="500"} 0
promhttp_metric_handler_requests_total{code="503"} 0
prometheus -h {#ID_APP_PROMETHEUS_HELP}
prometheus -h
usage: prometheus [<flags>]

The Prometheus monitoring server

Flags:
  -h, --help                     Show context-sensitive help (also try --help-long and --help-man).
      --version                  Show application version.
      --config.file="prometheus.yml"
                                 Prometheus configuration file path.
      --web.listen-address="0.0.0.0:9090"
                                 Address to listen on for UI, API, and telemetry.
      --web.read-timeout=5m      Maximum duration before timing out read of the request, and closing idle connections.
      --web.max-connections=512  Maximum number of simultaneous connections.
      --web.external-url=<URL>   The URL under which Prometheus is externally reachable (for example, if Prometheus is served via a reverse proxy). Used for generating
                                 relative and absolute links back to Prometheus itself. If the URL has a path portion, it will be used to prefix all HTTP endpoints
                                 served by Prometheus. If omitted, relevant URL components will be derived automatically.
      --web.route-prefix=<path>  Prefix for the internal routes of web endpoints. Defaults to path of --web.external-url.
      --web.user-assets=<path>   Path to static asset directory, available at /user.
      --web.enable-lifecycle     Enable shutdown and reload via HTTP request.
      --web.enable-admin-api     Enable API endpoints for admin control actions.
      --web.console.templates="consoles"
                                 Path to the console template directory, available at /consoles.
      --web.console.libraries="console_libraries"
                                 Path to the console library directory.
      --web.page-title="Prometheus Time Series Collection and Processing Server"
                                 Document title of Prometheus instance.
      --storage.tsdb.path="data/"
                                 Base path for metrics storage.
      --storage.tsdb.retention=STORAGE.TSDB.RETENTION
                                 [DEPRECATED] How long to retain samples in storage. This flag has been deprecated, use "storage.tsdb.retention.time" instead
      --storage.tsdb.retention.time=STORAGE.TSDB.RETENTION.TIME
                                 How long to retain samples in storage. When this flag is set it overrides "storage.tsdb.retention". If neither this flag nor
                                 "storage.tsdb.retention" nor "storage.tsdb.retention.size" is set, the retention time defaults to 15d.
      --storage.tsdb.retention.size=STORAGE.TSDB.RETENTION.SIZE
                                 [EXPERIMENTAL] Maximum number of bytes that can be stored for blocks. Units supported: KB, MB, GB, TB, PB. This flag is experimental and
                                 can be changed in future releases.
      --storage.tsdb.no-lockfile
                                 Do not create lockfile in data directory.
      --storage.tsdb.allow-overlapping-blocks
                                 [EXPERIMENTAL] Allow overlapping blocks which in-turn enables vertical compaction and vertical query merge.
      --storage.remote.flush-deadline=<duration>
                                 How long to wait flushing sample on shutdown or config reload.
      --storage.remote.read-sample-limit=5e7
                                 Maximum overall number of samples to return via the remote read interface, in a single query. 0 means no limit.
      --storage.remote.read-concurrent-limit=10
                                 Maximum number of concurrent remote read calls. 0 means no limit.
      --rules.alert.for-outage-tolerance=1h
                                 Max time to tolerate prometheus outage for restoring 'for' state of alert.
      --rules.alert.for-grace-period=10m
                                 Minimum duration between alert and restored 'for' state. This is maintained only for alerts with configured 'for' time greater than
                                 grace period.
      --rules.alert.resend-delay=1m
                                 Minimum amount of time to wait before resending an alert to Alertmanager.
      --alertmanager.notification-queue-capacity=10000
                                 The capacity of the queue for pending Alertmanager notifications.
      --alertmanager.timeout=10s
                                 Timeout for sending alerts to Alertmanager.
      --query.lookback-delta=5m  The delta difference allowed for retrieving metrics during expression evaluations.
      --query.timeout=2m         Maximum time a query may take before being aborted.
      --query.max-concurrency=20
                                 Maximum number of queries executed concurrently.
      --query.max-samples=50000000
                                 Maximum number of samples a single query can load into memory. Note that queries will fail if they would load more samples than this
                                 into memory, so this also limits the number of samples a query can return.
      --web.cors.origin=".*"     Regex for CORS origin. It is fully anchored. Eg. 'https?://(domain1|domain2)\.com'
      --log.level=info           Only log messages with the given severity or above. One of: [debug, info, warn, error]
      --log.format=logfmt        Output format of log messages. One of: [logfmt, json]
COMPARISON TO ALTERNATIVES {#ID_APP_CTA}
Prometheus vs. Graphite
Scope
Graphite专注于被动的时序数据库加上查询语言加上展示界面功能。任何其他的功能点都由外部组件提供。
Prometheus是一个全面的监控和趋势追踪系统,包含了基于时序数据库的内建的主动式获取、存储、查询、图像化以及报警功能。在Prometheus中定义了何谓正确的行为(哪些终端应该存在,哪些时序模式意味着错误,等等),并能够主动查找错误。
Data model
Graphite在命名的时序字段内存储数字化的采样值,这和Prometheus类似。然而,Prometheus的metadata模型更丰富:Graphite的metric由.分隔的组件组成,并隐式编码维度,而Prometheus则显示地将维度编码为键值对,这被称为labels,并附加在metric上。这使得使用labels进行过滤、分组、匹配更为简单。
更进一步,特别当Graphite与StatsD结合使用的时候,通常会仅存储所有被监控实例的聚合数据,而不是将实例作为一个维度进行保存,并能够深入挖掘单独的有问题实例。
举例来说,存储响应码为500、方法为POST、发送到API服务器上/tracks端点的HTTP请求数量,一般在Graphite/StatsD会存储为:
stats.api-server.tracks.post.500 -> 93在Prometheus中,相同的数据则会被编码为(假设有三个API服务器实例):
api_server_http_requests_total{method="POST",handler="/tracks",status="500",instance="<sample1>"} -> 34
api_server_http_requests_total{method="POST",handler="/tracks",status="500",instance="<sample2>"} -> 28
api_server_http_requests_total{method="POST",handler="/tracks",status="500",instance="<sample3>"} -> 31
Storage
Graphite将时序数据以Whisper格式存储在本地磁盘上,这是一个RDD-style的数据库,要求采样数据以固定间隔存储进入。每个时序数据被存储为单独的文件,而每隔一段固定时长,新的采样数据则会覆盖旧的数据。
Prometheus也会在本地磁盘按照每个时序数据创建一个本地文件,但允许采样数据按随机的时间间隔进行存储,只要采样行为和规则评估行为发生。由于新的数据会被简单附加在后面,旧的数据会被保存不定时长。Prometheus在处理短存活周期、频繁变动的时序数据时也能很好工作。
Summary
Prometheus提供了更丰富的数据模型和查询语言,此外还更容易运行并整合进你的环境。但如果你希望一个集群化的解决方案,并希望能长期保存历史数据,那么Graphite会是一个更好的选择。
Prometheus vs. InfluxDB
InfluxDB是一个开源的时序数据库,并有一个可扩展和可集群化的商业选项。InfluxDB项目是在Prometheus的研发开始之后一年才被release出来的,因此我们之前无法将其作为一个竞品进行考虑。当然,Prometheus和InfluxDB之间还是有显著区别的,并且双方系统都是朝着不同的用例进行设计实施的。
Scope
为了公平起见,我们还必须将Kapacitor和InfluxDB一起考虑,将这两者组合起来之后,他们解决的是和Prometheus以及Alertmanager相同的问题领域。
在scope方面,InfluxDB和Graphite对Prometheus的差异是类似的。除此之外,InfluxDB提供了连续查询(continuous queries),和Prometheus的记录规则(recording rules)是等价的。
Kapacitor的领域则是Prometheus记录规则(recording rules)、报警规则(alerting rules)以及Alertmanager的通知功能的综合。Prometheus提供了相对来说更强大的查询语言与图像化、报警功能。Prometheus Alertmanager额外提供了分组、去重以及静默功能。
Data model / storage
和Prometheus类似,InfluxDB数据模型也使用键值对作为labels,在InfluxDB中这被称为tags。此外,InfluxDB拥有一个二级labels被称为fields,这个fields在使用上更受限。InfluxDB支持纳秒级别的timestamps,以及float64、int64、bool、字符串,这几种数据类型。Prometheus,根据约定,支持float64数据类型以及支持受限的字符串,以及毫秒级别的timestamps。
INfulxDB使用带有预写日志的多样的 log-structured merge tree 来进行存储。这比Prometheus的每种时间序列仅追加的文件方案更加适合进行事件日志。
日志和Metrics以及图,描述了事件日志和Metrics记录之间的区别。
Architecture
Prometheus服务器每一个都是单独运行的,与其他服务器分离,并仅依赖它们的本地存储来进行核心功能服务:抓取数据、规则处理,以及警告。开源版本的InfluxDB也是类似的。
商业版的InfluxDB提供了,按设计所述,一个分布式存储集群,同时有许多集群节点处理存储和查询。
这意味着商业版的InfluxDB更容易水平扩展,但这也意味着必须一开始就处理一个复杂的分布式存储系统。Prometheus更容易使用,但在某个时间点将必须手动地根据扩展边界来拓展服务器,比如说根据产品、服务、数据中心,或类似的概念。单独的服务器(可以平行运作)也可以给你更好的可靠性以及错误隔离。
Kapacitor的开源release并没有内建的针对规则、警告、通知的分布式/冗余选项。开源版本可以通过用户手动分割的方式进行扩展,类似于Prometheus。Influx提供了企业版本的Kapacitor,支持高可用/冗余的告警系统。
Prometheus以及Alertmanager按约定提供了一个完全开源的冗余选项,通过运行冗余的Prometheus复制(replicas),以及使用Alertmanager的高可用模式。
Summary
Prometheus和InfluxDB系统有诸多相似之处。都具有labels(在InfluxDB里被称为tags)来支持高效的多维度metrics。都使用相同的数据压缩算法。都有扩展集成。都有钩子允许你拓展它们的功能,比如说在统计工具中分析数据或进行自动化处理等。
InfluxDB做的更好的地方:
- 使用InfluxDB系统进行事件日志处理
- 商业版本提供了系统集群化,对长期的数据存储来说也是更好的选择
- 在多个复制之间保持数据的最终一致性
Prometheus做的更好的地方:
- 使用Prometheus系统来进行metrics监控
- 更强大的查询语言、报警以及通知功能
- 高可用以及图像化的运行时长以及报警
InfluxDB是由单一商业公司维护的,其模式为:核心功能开源,提供会员功能比如说闭源的集群功能、托管功能以及支持。Prometheus是一个完全开源且独立的项目,由一系列公司及独立个体进行维护,部分其中的成员也提供商业服务及支持。
Prometheus vs. OpenTSDB
OpenTSDB是一个分布式的时序数据库,基于Hadoop以及HBase。
Scope
在scope方面,其与Prometheus的差别和Graphite一样。
Data model
OpenTSDB的数据模型基本上和Prometheus是一致的:时序由一系列任意的键值对进行识别(OpenTSDB中的tags就是Prometheus中的labels)。针对一个metrics的数据是存储在一起的,限制metrics的基数。也有些微的不同:Prometheus允许label值中存在任意的字符,而OpenTSDB则更具有限制性。OpenTSDB也缺乏一个查询语言,仅允许通过API进行简单的聚合以及数学查询。
Storage
OpenTSDB的存储是基于Hadoop以及HBase进行实现的。这意味着对OpenTSDB进行水平扩展是容易的,但你必须接受从一开始就运作一个Hadoop/HBase集群的复杂性。
Prometheus作为初始是非常容易直接开始运作的,但当单节点已经无法承载的时候则需要手动进行进行分片。
Summary
Prometheus提供了更丰富的查询语言,能处理更高的metrics技术,并胜任一个完整的监控系统。如果你已经有运行中的Hadoop集群,且希望拥有一个长期的数据存储更胜于之前所述的优点,那OpenTSDB就是更好的选择。
Prometheus vs. Nagios
Nagios是由NetSaint公司自1990年代开始发起的一个监控系统。
Scope
Nagios是一个主要基于已经存在的脚本代码进行告警的系统。这些被称为checks。可以针对单独的告警进行静默处理,然而并没有分组、路由以及去重。
Nagios拥有大量的插件。举例来说,使用几K的perfData插件就能允许向一个时序数据库(例如Graphite)输出数据或者使用NRPE就可以在远程机器上运行checks。
Data model
Nagios是基于主机的。每个主机可以有一个或多个服务,然后每个服务可以运行一个check。
并不存在labels的概念或一个查询语言。
Storage
Nagios并没有存储,只有状态check。有插件可以存储数据来进行图形化。
Architecture
Nagios服务器是独立运作的。所有的checks都是通过配置文件来进行管理的。
Summary
Nagios适合小型的静态的系统的基本监控(基本上是黑盒状态)。
如果你希望拥有可调整的白盒监控,或拥有一个动态的基于云的环境,那么Prometheus是更好的选择。
Prometheus vs. Sensu
Sensu是一个可编组的监控管线,可以复用已经存在的Nagios checks。
Scope
在scope方面其和Nagios是一致的。
由客户端socket来支持将临时的check结果推送到Sensu。
Data model
Sensu的数据模型和Nagios一致。
Storage
Sensu使用Redis来持久化监控数据,包括了Sensu的客户端注册,check结果,check执行历史,以及当前的事件数据。
Architecture
Sensu有一系列的组件。它使用RabbitMQ来传输数据,Redis来处理当前状态,以及一个单独的服务器来处理访问请求。
一个Sensu部署的所有组件(RabbitMQ、Redis以及Sensu 服务器/API)可以做成集群化来支持高可用、冗余配置。
Summary
如果你手头有一个存在的Nagios,且你希望扩展它,或者希望利用Sensu的自动化注册功能,那么Sensu是一个好选择。
如果你希望进行白盒监控,或希望有动态的基于云的环境,那么Prometheus是一个好的选择。
EOF