How to do MySQL stress test
1. Foreword
In this article we will go through how to do a RDBMS stress test using tool sysbench. In the article we are talking about MySQL, as sysbench also supports other DBs like PostgreSQL, you can replace MySQL with other DBs according to your requirement.
Scenario
Say we have a BE application like this:
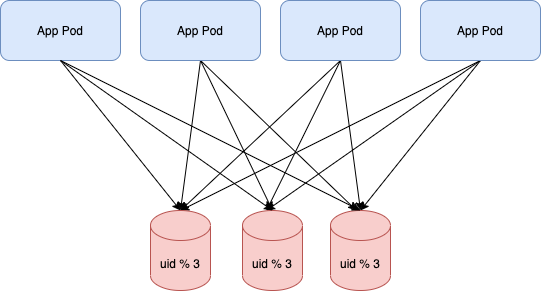
It contains several application containers and several DB instances, each app would establish one connection to each DB instance.
Then we’d like to know under the target / high stress, what will happen to the DB instance, would they be able to handle the stress with ease or crash.
To figure out this, we can’t simply use a client process to send batch of duplicated SQL queries to DB instance. We need to mock the business like our BE app would do.
So several steps we need to do.
2. DB Metrics
First we need to figure out what’s the metrics we need to monitor in the stress test.
Basically:
- MySQL instance CPU usage
- MySQL instance Memory usage
- MySQL connection amount
- MySQL query amount
- MySQL table lock wait:
show status;->table_locks_waited - MySQL innodb lock wait:
show status like 'innodb_row_lock%';->innodb_row_lock_waitsinnodb_row_lock_time_avg - MySQL slow sql log
- Host server CPU usage
- Host server Memory usage
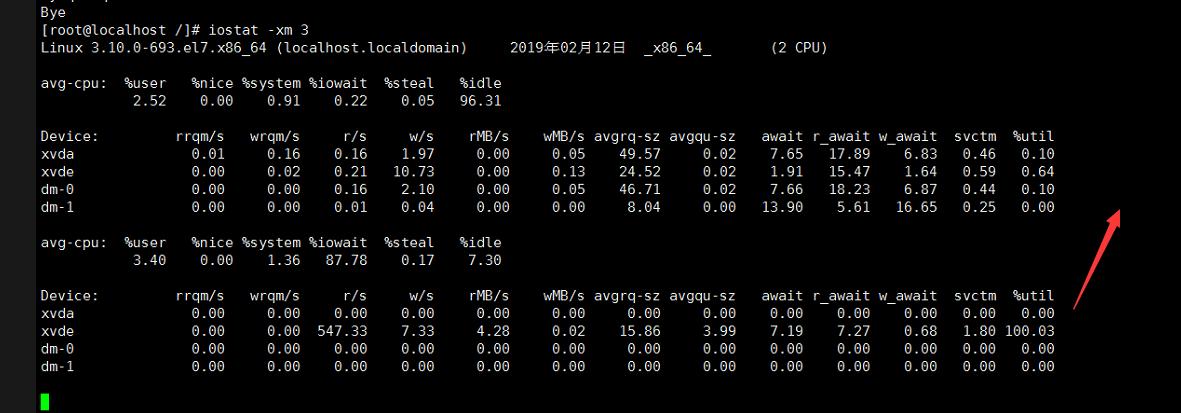
- Host server io status:
iostat -d -x -k 1, show device data show extend data show KB value refresh every 1 second- %util 1-100, 100 means all io occupied
- svctm closing to await means almost no wait
- await > svctm means long io queue
- avgqu-sz : average queue size
For more metrics you may want to learn:
- Run MySQL command:
show status; - Download/View grafana dashboard: percona/grafana-dashboards
3. Determine Stress
In this step we need to figure out the expected stress level.
3 items to be determined:
- How many records shall be in db table
- How many connections
- How’s the expected TPS
DB performance may fluctuate markedly according to the amount of records in table and amount of connections.
How (for example):
- Records amount
- App users 100K
- Records of each user 5
- Total records amount: 100K * 5 = 500K
- Connections amount
- BE pod amount -> connections amount
- TPS
- Best is to see the production monitoring data, most real data
- Secondary is deducing, for example like
- 1k online user
- each user 1 api/sec
- 1 api -> 1 transaction
- 1k * 1tps = 1k tps
4. Prepare SQL Statements
In this step we need to figure out the SQL statements which would be used in the stress test.
How:
- set up the staging backend server with monitoring, especially DB sql monitoring
- run app with user-like actions
- see the sql statements logged in binlog
- pick top X statements of
CRUDeach type, like:- SELECT: SQL1, SQL2, SQL3
- UPDATE: SQLa, SQLb, SQLc
- also grab the CRUD ratio, like: 60% select 35% update 4% create 1% delete
5. Prepare LUA script
In this step we need to prepare the lua script which would be executed by the sysbench. There are multiple threads in sysbench, each thread will execute the LUA script rather than running SQL statement directly.
The script will:
- determine every time execution which type of CRUD SQL should be executed, finally the CRUD ratio should be consistent with the percentage we got in step 4
- select one SQL statement from the CRUD type SQL pool
- execute the SQL
Using this LUA script we can mock the SQL executions just like the CRUD ratio we got in step 4, and SQLs are also we prepared in step 4.
LUA example:
function prepare()
    print("prepare of stress test")
end

function cleanup()
    print("cleanup of stress test")
end

function help()
    print("sysbench stress test; no special command line options available")
end

function thread_init(thread_id)
end

function thread_done(thread_id)
    db_disconnect()
end

function event(thread_id)

    -----------------------------------------------------------------------------------------------------------------------
    -- CONST
    -----------------------------------------------------------------------------------------------------------------------

    local SEARCH_KEY_PH = "^SK"
    local RANDOM_INT_PH = "^RI"

    -----------------------------------------------------------------------------------------------------------------------
    -- PARAMS
    -----------------------------------------------------------------------------------------------------------------------

    local totalRowsOfRecordsInDb = 10000

    local cmdSeed = {
        select = 3000,
        insert = 150,
        delete = 80,
        update = 6770
    }

    selectQueries = {}
    selectQueries["SELECT plantId, userId, seedId, status, growTime, harvestTime, blightTime, rarity, residue, leaf FROM fs2_plant_plants WHERE userId = ^SK;"] = 100
    selectQueries["SELECT userId, finished FROM module_mission_finished WHERE userId = ^SK;"] = 100
    selectQueries["SELECT userId, activityId, decorId, finished, acceptedRewards, expensePoint FROM fs2_activity_party WHERE userId = ^SK;"] = 100
    selectQueries["SELECT userId, customerDefId, level, exp, rewards FROM fs2_customer_friendship WHERE userId = ^SK;"] = 100
    selectQueries["SELECT userId, missionId, progress, acceptTime, expireTime FROM module_mission_in_progress WHERE userId = ^SK;"] = 100
    selectQueries["SELECT userId, activityId, collect FROM fs2_activity_collect WHERE userId = ^SK;"] = 100
    selectQueries["SELECT userId, gridId, layer1Type, layer1, layer2Type, layer2, layer3Type, layer3 FROM fs2_grounds WHERE userId = ^SK;"] = 100
    selectQueries["SELECT decorId, decorDefId, userId, orient, cooldown, buildId, isUpgrade, effectCountLeft, resourceCountLeft, requestAccepted, output, withActivityOutput, freeMode FROM fs2_decoration WHERE userId = ^SK;"] = 100
    selectQueries["SELECT requestId, receiverId, senderId, helpId, type, info, time, expire, platformRequestId FROM fs2_social_request WHERE receiverId = ^SK;"] = 100
    selectQueries["SELECT userId, customerDefIds FROM fs2_customer_event WHERE userId = ^SK;"] = 100


    insertQueries = {}
    insertQueries["insert into `fv_dev`.`fs2_pet` ( `status`, `userId`, `fodderId`, `feedUpCount`, `feedUpTime`, `petDefId`) values ( '0', '89', '780003', '1', '1438223373', '900001');"] = 100
    insertQueries["insert into fs2_plant_plants (userId,seedId,status,growTime,harvestTime,blightTime,rarity,residue,leaf,soilId,soilType,soilCount,harvestCount,wood,requestAccepted,withActivityOutput) values ('57332', '110001', '1', '1428746759', '1428746819', '1429005959', '0', '0', '0', '0', '0', '0', '0', '0', null, null); "]=100


    updateQueries = {}
    updateQueries["UPDATE module_achievement_in_progress SET progress = '[3333333333,44444,5555555555555,7777777777777777777777,^RI,111111111111,22222222222222222222,999999999999999999999999,00000000]' WHERE userId = ^SK;"] = 1000
    updateQueries["UPDATE module_profile_infos SET info = ^RI, time = ^RI WHERE userId = ^SK;"] = 700
    updateQueries["UPDATE fs2_plant_plants SET seedId = ^RI, status = ^RI, growTime = ^RI, harvestTime = ^RI, blightTime = ^RI, rarity = ^RI, leaf = ^RI, residue = ^RI WHERE plantId = ^SK;"] = 700
    updateQueries["UPDATE module_profile SET  exp = exp + 1 WHERE userId = ^SK;"] = 500
    updateQueries["UPDATE module_mission_in_progress SET progress = '[3333333333,44444,5555555555555,7777777777777777777777,^RI,111111111111,22222222222222222222,999999999999999999999999,00000000]', acceptTime = ^RI WHERE userId = ^SK;"] = 300
    updateQueries["UPDATE module_item SET  updateTime = ^RI WHERE userId = ^SK;"] = 700
    updateQueries["UPDATE fs2_plant_seeds SET exp = ^RI WHERE userId = ^SK;"] = 100
    updateQueries["UPDATE fs2_social_feed SET helpId = ^RI, status = ^RI WHERE userId = ^SK;"] = 100
    updateQueries["UPDATE fs2_pet SET feedUpCount = ^RI, feedUpTime = ^RI, status = ^RI WHERE petId = ^SK;"] = 100
    updateQueries["UPDATE fs2_customer SET exp = ^RI, status = ^RI WHERE userId = ^SK;"] = 50
    updateQueries["UPDATE fs2_customer_town SET missionId = ^RI, leaveTime = ^RI WHERE customerId = ^SK;"] = 300
    updateQueries["UPDATE fs2_activity SET count = ^RI, status = ^RI WHERE userId = ^SK;"] = 100

    deleteQueries = {}
    deleteQueries["delete from fs2_plant_plants where userId=57332 limit 1;"] = 500
    deleteQueries["delete from fs2_pet where userId=89 limit 1;"] =500

    -----------------------------------------------------------------------------------------------------------------------
    -- LIB
    -----------------------------------------------------------------------------------------------------------------------

    local function randItem(seedTable)
        local result = 0

        local seedSum = 0
        for key, value in pairs(seedTable) do
            seedSum = seedSum + value
        end

        local randSeed = sb_rand(1, seedSum)

        local sum = 0

        for cmdType, prob in pairs(seedTable) do
            sum = sum + prob
            if randSeed <= sum then
                result = cmdType
            break end
        end


        return result
    end

    local function processSleep()
        os.execute("sleep 0.01") -- 10ms
    end

    -----------------------------------------------------------------------------------------------------------------------
    -- EXEC
    -----------------------------------------------------------------------------------------------------------------------

    local cmdType = randItem(cmdSeed)
    --print(cmdType)

    --if cmdType == "insert" or cmdType == "delete" then
    --    cmdType = "update"
    --end

    local querySeed = _G[cmdType .. "Queries"]

    local sql = randItem(querySeed)
    --print(sql)

    if cmdType == "update" then
        sql = sql:gsub("%^RI", sb_rand(1, totalRowsOfRecordsInDb))
    end
    sql = sql:gsub("%^SK", sb_rand(1, totalRowsOfRecordsInDb))

    --processSleep() -- let the lua script sleep to make qps lower for testing, if necessary

    db_query(sql)

end
You may find a sleep function processSleep, in old sysbench version there is no way to control the TPS speed, so this function could help to slow down the execution. In latest versions, sysbench provided the option to control tps, so it’s no longer necessary.
6. Run the test
In this step we will see how to run sysbench to execute the stress test.
$ sysbench --version
sysbench 1.0.18
Several useful options:
--threads: How many thread running inside the sysbench, each thread means a db connection--rate: TPS, 0 means no limit, query as fast as possible--events: Total requests to be made in the whole stress test, use this or--time--time: How long should the stress test last, in seconds, use this or--events
Steps to run the stress test:
- Start the MySQL instance along with all the monitoring facilities
- Create database and table with schema SQL
- Create the initial records in the db table
- Run sysbench with low threads and rate, to warm up the MySQL instance (cache, index, etc…)
- Run sysbench with target rate
- See monitoring, check the CPU Memory iostat and lock waiting
$ sysbench \
  --threads=128 \
  --rate=300 \
  --time=3600 \
  --percentile=99 \
  --report-interval=5 \
  --db-driver=mysql \
  --mysql... \
  ./test_strategy.lua \
  run
After the test, see the monitoring system to grab the conclusion. Or may be need to analyse the cause of the performance issues.
Others
Optimize table
Use OPTIMIZE TABLE to resort index to restore the performance. After a lot of CRUD, the InnoDB index may be messed up, and the performance reduced. You can perform this command between several rounds of tests.
You can use OPTIMIZE TABLE to reclaim the unused space and to defragment the data file. After extensive changes to a table, this statement may also improve performance of statements that use the table, sometimes significantly.
OPTIMIZE TABLE works for InnoDB, MyISAM, and ARCHIVE tables. OPTIMIZE TABLE is also supported for dynamic columns of in-memory NDB tables. It does not work for fixed-width columns of in-memory tables, nor does it work for Disk Data tables.
- For InnoDB tables, optimize table will simply perform an alter table to reclaim the space.
- If you have indexes, it will also resort the index pages, and update the statistics.
OPTIMIZE TABLE XXX;Test the server io first
You may need to test the server io before test db, since the io of some cloud servers is not the same as claimed. You can still use sysbench to do it.
Create test file:
$ sysbench \
  --file-num=4 \
  --file-block-size=8k \
  --file-total-size=4G \
  --file-test-mode=rndrd \
  --file-extra-flags=direct \
  --max-requests=0 \
  --time=1200 \
  --threads=4 \
  fileio prepare
Test random read performance:
$ sysbench \
  --file-num=4 \
  --file-block-size=8k \
  --file-total-size=4G \
  --file-test-mode=rndrd \
  --file-extra-flags=direct \
  --max-requests=0 \
  --time=30 \
  --threads=4 \
  --report-interval=3 \
  fileio run
Reference
- Load Testing vs Stress Testing vs Performance Testing: Difference Discussed
- How to Benchmark Performance of MySQL & MariaDB Using SysBench
- How to Optimize MySQL Tables and Defragment to Recover Space
- 漫谈MySQL的锁机制
- Docs » 工具参考篇 » 11. iostat 监视I/O子系统
- Ioss for sysbench, iostat test server
Appendix
sysbench —help
$ sysbench --help
Usage:
  sysbench [options]... [testname] [command]

Commands implemented by most tests: prepare run cleanup help

General options:
  --threads=N                     number of threads to use [1]
  --events=N                      limit for total number of events [0]
  --time=N                        limit for total execution time in seconds [10]
  --forced-shutdown=STRING        number of seconds to wait after the --time limit before forcing shutdown, or 'off' to disable [off]
  --thread-stack-size=SIZE        size of stack per thread [64K]
  --rate=N                        average transactions rate. 0 for unlimited rate [0]
  --report-interval=N             periodically report intermediate statistics with a specified interval in seconds. 0 disables intermediate reports [0]
  --report-checkpoints=[LIST,...] dump full statistics and reset all counters at specified points in time. The argument is a list of comma-separated values representing the amount of time in seconds elapsed from start of test when report checkpoint(s) must be performed. Report checkpoints are off by default. []
  --debug[=on|off]                print more debugging info [off]
  --validate[=on|off]             perform validation checks where possible [off]
  --help[=on|off]                 print help and exit [off]
  --version[=on|off]              print version and exit [off]
  --config-file=FILENAME          File containing command line options
  --tx-rate=N                     deprecated alias for --rate [0]
  --max-requests=N                deprecated alias for --events [0]
  --max-time=N                    deprecated alias for --time [0]
  --num-threads=N                 deprecated alias for --threads [1]

Pseudo-Random Numbers Generator options:
  --rand-type=STRING random numbers distribution {uniform,gaussian,special,pareto} [special]
  --rand-spec-iter=N number of iterations used for numbers generation [12]
  --rand-spec-pct=N  percentage of values to be treated as 'special' (for special distribution) [1]
  --rand-spec-res=N  percentage of 'special' values to use (for special distribution) [75]
  --rand-seed=N      seed for random number generator. When 0, the current time is used as a RNG seed. [0]
  --rand-pareto-h=N  parameter h for pareto distribution [0.2]

Log options:
  --verbosity=N verbosity level {5 - debug, 0 - only critical messages} [3]

  --percentile=N       percentile to calculate in latency statistics (1-100). Use the special value of 0 to disable percentile calculations [95]
  --histogram[=on|off] print latency histogram in report [off]

General database options:

  --db-driver=STRING  specifies database driver to use ('help' to get list of available drivers) [mysql]
  --db-ps-mode=STRING prepared statements usage mode {auto, disable} [auto]
  --db-debug[=on|off] print database-specific debug information [off]


Compiled-in database drivers:
  mysql - MySQL driver

mysql options:
  --mysql-host=[LIST,...]          MySQL server host [localhost]
  --mysql-port=[LIST,...]          MySQL server port [3306]
  --mysql-socket=[LIST,...]        MySQL socket
  --mysql-user=STRING              MySQL user [sbtest]
  --mysql-password=STRING          MySQL password []
  --mysql-db=STRING                MySQL database name [sbtest]
  --mysql-ssl[=on|off]             use SSL connections, if available in the client library [off]
  --mysql-ssl-cipher=STRING        use specific cipher for SSL connections []
  --mysql-compression[=on|off]     use compression, if available in the client library [off]
  --mysql-debug[=on|off]           trace all client library calls [off]
  --mysql-ignore-errors=[LIST,...] list of errors to ignore, or "all" [1213,1020,1205]
  --mysql-dry-run[=on|off]         Dry run, pretend that all MySQL client API calls are successful without executing them [off]

Compiled-in tests:
  fileio - File I/O test
  cpu - CPU performance test
  memory - Memory functions speed test
  threads - Threads subsystem performance test
  mutex - Mutex performance test

See 'sysbench <testname> help' for a list of options for each test.
sysbench fileio help
$ sysbench fileio help
sysbench 1.0.18 (using bundled LuaJIT 2.1.0-beta2)

fileio options:
  --file-num=N                  number of files to create [128]
  --file-block-size=N           block size to use in all IO operations [16384]
  --file-total-size=SIZE        total size of files to create [2G]
  --file-test-mode=STRING       test mode {seqwr, seqrewr, seqrd, rndrd, rndwr, rndrw}
  --file-io-mode=STRING         file operations mode {sync,async,mmap} [sync]
  --file-extra-flags=[LIST,...] list of additional flags to use to open files {sync,dsync,direct} []
  --file-fsync-freq=N           do fsync() after this number of requests (0 - don't use fsync()) [100]
  --file-fsync-all[=on|off]     do fsync() after each write operation [off]
  --file-fsync-end[=on|off]     do fsync() at the end of test [on]
  --file-fsync-mode=STRING      which method to use for synchronization {fsync, fdatasync} [fsync]
  --file-merged-requests=N      merge at most this number of IO requests if possible (0 - don't merge) [0]
  --file-rw-ratio=N             reads/writes ratio for combined test [1.5]
EOF